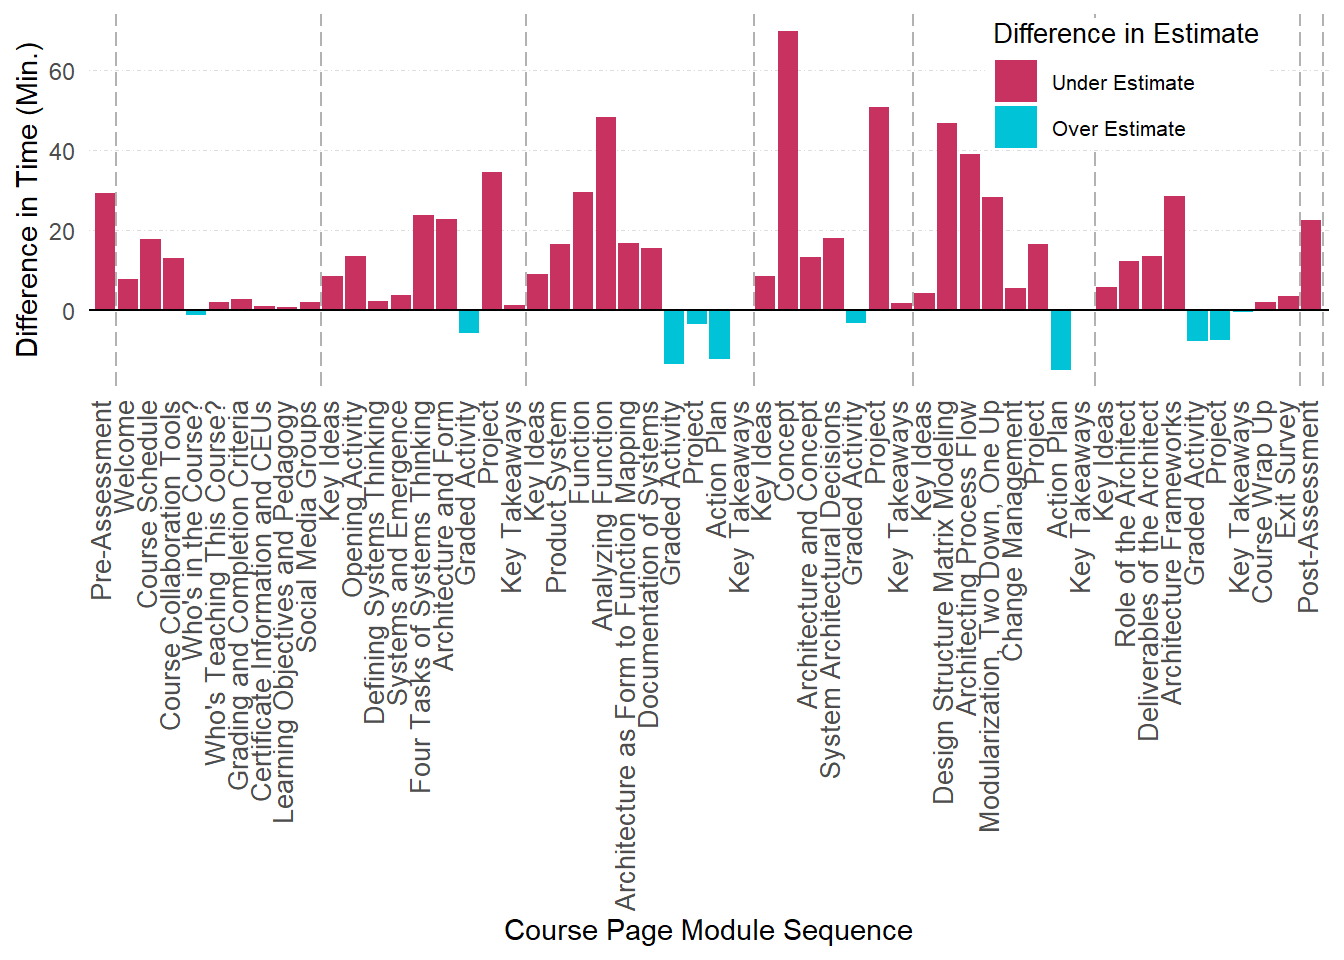
Figure 2B - Visualizing Difference Between Instructor Estimate and Students Use Time to Unit Completion
This R Markdown script reproduces Figure 2B from the paper, Ginda, M., Richey, M. C., Cousino, M., & Börner, K. (2019). Visualizing learner engagement, performance, and trajectories to evaluate and optimize online course design. PloS one, 14(5), e0215964.
The visualization documented here use analytic results for the MITxPro course, Architecture of Complex Systems (MITProfessionalX+SysEngxB1+3T2016), Fall 2016, with the edX Learner and Course Analytics Pipeline. More information about the data used in this visualization is available at Sample Data Index.
Environment Setup
This is an R Markdown document. Markdown is a simple formatting syntax for authoring HTML, PDF, and MS Word documents. For more details on using R Markdown see http://rmarkdown.rstudio.com.
#clean environment
rm(list=ls())

## Load required packages
require("RCurl")      #Loading data from web
require("grid")       #Visualizations base
require("plyr")       #Data aggregations
require("stringr")    #String manipulation
require("colorspace") #ColorSpace color pallete selection
require("ggplot2")    #GGplot 2 graphics library
Loading Data
The data set loaded as modules was created by the script edX-1-courseStructureMeta.R. Data represents the course structure used to represent the content of an edX course.
The data set loaded as moduleUse was created by the script edX-6-moduleUseAnalysis.R. Data represents an overall module engagement statistics for an identified group/cohort of student active in edX Course.
#Load Sample Data Set A
modules <- read.csv(text=getURL("https://raw.githubusercontent.com/cns-iu/edx-learnertrajectorynetpipeline/master/data/dataA.csv", ssl.verifypeer = FALSE), header=T)

#Load Sample Data Set C
moduleUse <- read.csv(text=getURL("https://raw.githubusercontent.com/cns-iu/edx-learnertrajectorynetpipeline/master/data/dataC.csv",ssl.verifypeer = FALSE), header=T)
Time to Completion Estimates for edX Course Chapters and Sequential Pages
In the example course, instructional designers estimated of how long they believe a student would take to complete each chapter unit of the course. Estimates for how longs students can expect to complete a unit or group of pages are to students (and analysts) through a brief module description. Chapter time to completion estimates are made in hours and minutes; sequential page time to completion estimates are provided in minutes.
Extracting Chapter Time to Completion Estimates
The sample data found in the modules data frame captures this information. The following section of code is used to extract these temporal estimates for the edX course chapter modules as a separate data frame chapterEst. In cases where a range of time is given (e.g. 4-5 hours), both min and maximum calculations are made. All hour estimates converted to minutes.
#Subset the course structure to keep only chapter modules
chapterEst <- modules[modules$mod_type==c("chapter"),c(2,7,5)]
names(chapterEst)[c(1,3)] <- c("parentID","parentLabel")
#Processing chapter labels to extract time estimates and estimate units
label<- sapply(chapterEst$parentLabel, function(x) str_split(x,"\\(")[[1]][2])
#Updates the Chapter Labels
chapterEst$parentLabel <- sapply(chapterEst$parentLabel, function(x) str_split(x,"\\(")[[1]][1]) %>% str_trim()

#Extracting Estimates
if(nrow(as.data.frame(regmatches(label[!is.na(label)],gregexpr("[[:digit:]]+\\.*[[:digit:]]*",label[!is.na(label)]))))==2){
  est <- regmatches(label[!is.na(label)],gregexpr("[[:digit:]]+\\.*[[:digit:]]*",label[!is.na(label)])) %>%
         as.data.frame(row.names = c("chpEstTime_min","chpEstTime_max")) %>%
         t() %>%
         as.data.frame(stringsAsFactors=F)
} else if(nrow(as.data.frame(regmatches(label[!is.na(label)],gregexpr("[[:digit:]]+\\.*[[:digit:]]*",label[!is.na(label)]))))==1){
  est <- regmatches(label[!is.na(label)],gregexpr("[[:digit:]]+\\.*[[:digit:]]*",label[!is.na(label)])) %>%
         as.data.frame(row.names = c("chpEstTime_min")) %>%
         t() %>%
         as.data.frame(stringsAsFactors=F)
  est$chpEstTime_max <- est$chpEstTime_min
}
rownames(est) <- 1:nrow(est)
est$chpEstTime_max <- as.numeric(est$chpEstTime_max)
est$chpEstTime_min <- as.numeric(est$chpEstTime_min)

#Estimate Unit
unit <- str_sub((lapply(label[!is.na(label)], function(x) str_split(x," ",n = 3)[[1]][2])),1,1)

#Combines estimates with estimate units
est <- cbind(est,unit)

#Convert all estimates in hours to minutes
est[est$unit=="h",c("chpEstTime_min","chpEstTime_max")] <- est[est$unit=="h",c("chpEstTime_min","chpEstTime_max")]*60

label<- as.data.frame(label,stringsAsFactors=F) %>% cbind(rep(as.data.frame(NA),3))
names(label)[2:4] <- names(est)
label[!is.na(label$label),2:4] <- est
chapterEst <- cbind(chapterEst,label[2:4])
chapterEst[is.na(chapterEst$chpEstTime_min),4:5] <- 0
chapterEst$unit <- "m"
str(chapterEst)
## 'data.frame': 8 obs. of 6 variables:
## $ parentID : Factor w/ 735 levels "003a48b7833a46feb5b56a684a115796",..: 119 170 73 295 457 65 174 282
## $ order : int 2 20 95 264 392 483 603 718
## $ parentLabel : chr "Pre-Assessment" "Get Started" "Week 1: Systems Thinking" "Week 2: Function and Emergence" ...
## $ chpEstTime_min: num 15 25 210 240 240 240 240 15
## $ chpEstTime_max: num 15 25 210 300 300 300 300 15
## $ unit : chr "m" "m" "m" "m" ...Extracting Sequential Page Time to Completion Estimates
Estimates of time to completion are also provided for sequential pages, which modules that group content and assessment modules as sub-units of a chapter. The inclusion of time to completion estimates for sequential pages edX course for more nuanced estimates of time to completion than for chapters provide, and are the estimates used for Figure 2B.
#Extracting chapter level temporal estimates
pageEst<- modules[modules$mod_type==c("sequential"),c(2,13,7,5)]
#Update field names
names(pageEst)[c(1:2,4)] <- c("id","parentID","label")
#Updates order based on row numbers
pageEst$order <- 1:nrow(pageEst)
#Processing chapter labels to extract time estimates and estimate units
label <- sapply(pageEst$label, function(x) str_split(x,"\\(")[[1]][2])
label <- cbind(as.character(pageEst$id),label) %>% data.frame(stringsAsFactors = F)
names(label)[1] <- "id"
#Updates the Chapter Labels
pageEst$label<- sapply(pageEst$label, function(x) str_split(x,"\\(")[[1]][1]) %>% str_trim()

#Extracting Estimates
if(nrow(as.data.frame(regmatches(label[!is.na(label$label),]$label, gregexpr("[[:digit:]]+\\.*[[:digit:]]*",
                    label[!is.na(label$label),]$label))))==2){
  est <- regmatches(label[!is.na(label$label),]$label,gregexpr("[[:digit:]]+\\.*[[:digit:]]*",
                    label[!is.na(label$label),]$label)) %>%
         lapply(function(x) if(identical(x, character(0))) NA_character_ else x) %>%
         as.data.frame(row.names = c("pageEstTime_min","pageEstTime_max"), stringsAsFactors = F) %>%
         t() %>%
         as.data.frame(stringsAsFactors=F)
  est <- cbind(as.character(label[!is.na(label$label),]$id),est)
  names(est)[1] <- "id"
} else if(nrow(as.data.frame(regmatches(label[!is.na(label$label),]$label, gregexpr("[[:digit:]]+\\.*[[:digit:]]*",
                    label[!is.na(label$label),]$label))))==1){
  est <- regmatches(label[!is.na(label$label),]$label, gregexpr("[[:digit:]]+\\.*[[:digit:]]*",
                    label[!is.na(label$label),]$label)) %>%
         lapply(function(x) if(identical(x, character(0))) NA_character_ else x) %>%
         as.data.frame(row.names = c("pageEstTime_min"), stringsAsFactors = F) %>%
         t() %>%
         as.data.frame(stringsAsFactors=F)
   est <- cbind(as.character(label[!is.na(label$label),]$id),est)
   names(est)[1] <- "id"
}
if(length(est$pageEstTime_min)!=length(est$pageEstTime_max)){
  est$pageEstTime_max <- est$pageEstTime_min
}
rownames(est) <- 1:nrow(est)
est$pageEstTime_max <- as.numeric(est$pageEstTime_max)
est$pageEstTime_min <- as.numeric(est$pageEstTime_min)

#Extracts Unit of Time Estimate
label <- cbind(label,str_sub((lapply(label$label, function(x) str_split(x," ",n = 3)[[1]][2])),1,1))
names(label)[3] <- "unit"

#Convert all estimates in hours to minutes
label <- join(label[,c("id","unit")],est,by="id")
label[label$unit=="h" & is.na(label$unit)==F,c("pageEstTime_min","pageEstTime_max")] <-
 label[label$unit=="h" & is.na(label$unit)==F,c("pageEstTime_min","pageEstTime_max")]*60

#Combine pageEst and est dataframe
pageEst <- cbind(pageEst,label[2:4])
if(nrow(pageEst[is.na(pageEst$pageEstTime_min),c("pageEstTime_min","pageEstTime_max")])>0){
  pageEst[is.na(pageEst$pageEstTime_min),c("pageEstTime_min","pageEstTime_max")] <- 0
}
#Updates units to correct measure for all fields
pageEst$unit <- "m"
str(pageEst)
## 'data.frame': 54 obs. of 7 variables:
## $ id : Factor w/ 735 levels "003a48b7833a46feb5b56a684a115796",..: 254 154 343 11 567 594 273 242 162 405 ...
## $ parentID : Factor w/ 184 levels "03a3841a0f684ecd93995d985355da91",..: 35 54 54 54 54 54 54 54 54 54 ...
## $ order : int 1 2 3 4 5 6 7 8 9 10 ...
## $ label : chr "Pre-Assessment" "Welcome" "Course Schedule" "Course Collaboration Tools" ...
## $ unit : chr "m" "m" "m" "m" ...
## $ pageEstTime_min: num 0 3 3 5 2 4 1 1 2 1 ...
## $ pageEstTime_max: num 0 3 3 5 2 4 1 1 2 1 ...Combining the Chapter Level and the Page Level Time Estimates of Completion
Note, some sequential pages do not have estimates for the time necessary to completion. For the course profiled, the page modules without time to completion estimates happen to be survey instruments administer by instructional designers.
A review of the chapter level estimates for these surveys range between 15 and 300 minutes; the 300 minute estimate for a chapter with multiple units, and is too large for a apply to the survey. Instead, we take the mode of estimate used for all survey instruments (15 minutes) to apply
#Left join of the pageEst and chapterEst dataframes. Combining Chapter Module Labels, and maximum time estimates
#The chapter label
pageEst <- join(pageEst, chapterEst[,c(1,3,5)], by="parentID", type="left")

#Statistical mode function
getMode <- function(x, na.rm = FALSE) {
  if(na.rm){
    x = x[!is.na(x)]
  }
  ux <- unique(x)
  return(ux[which.max(tabulate(match(x, ux)))])
}
#Updating the records with NA for the pageEstTime_max and replacing them with chapter level mode for survey instruments
if(length(pageEst[is.na(pageEst$pageEstTime_max),]$pageEstTime_max)>0){
  pageEst[is.na(pageEst$pageEstTime_max),]$pageEstTime_max <-
    getMode(pageEst[is.na(pageEst$pageEstTime_max),]$chpEstTime_max, na.rm=T)
}
#Final pageEst dataframe
pageEst <- pageEst[,c(1:4,8,5:7,9)]
str(pageEst)
## 'data.frame': 54 obs. of 9 variables:
## $ id : Factor w/ 735 levels "003a48b7833a46feb5b56a684a115796",..: 254 154 343 11 567 594 273 242 162 405 ...
## $ parentID : Factor w/ 184 levels "03a3841a0f684ecd93995d985355da91",..: 35 54 54 54 54 54 54 54 54 54 ...
## $ order : int 1 2 3 4 5 6 7 8 9 10 ...
## $ label : chr "Pre-Assessment" "Welcome" "Course Schedule" "Course Collaboration Tools" ...
## $ parentLabel : chr "Pre-Assessment" "Get Started" "Get Started" "Get Started" ...
## $ unit : chr "m" "m" "m" "m" ...
## $ pageEstTime_min: num 0 3 3 5 2 4 1 1 2 1 ...
## $ pageEstTime_max: num 0 3 3 5 2 4 1 1 2 1 ...
## $ chpEstTime_max : num 15 25 25 25 25 25 25 25 25 25 ...Calculating Temporal Use Measures of edX Course’s Chapters
Next, Data C contains descriptive for use each content and assessment module for the course based on analysis of all active students in the course. The course’s chapter, sequential and vertical modules are excluded from the data; however, the hierarchical relationships of content and assessment modules to chapter and sequential modules identifiers through the L1 and L2 fields.
The ddply function is used to calculate the total of average time spent using sequential modules by active students in an edX course. The function uses an average time spent per content module, which was calculated in Script 7 by dividing the totalTime by unq_stu field.
#Removes modules that have no time associated with them (typically HTML pages)
moduleUse <- moduleUse[moduleUse$totalTime>0,]

#Aggregate temporal and user data for sequential page modules IDs (L2)
pageUse <- ddply(moduleUse,.(L2),summarize,
                avgTime_total  = sum(avgTimeStu,na.rm=T))
names(pageUse)[1] <- "id"
str(pageUse)
## 'data.frame': 54 obs. of 2 variables:
## $ id : Factor w/ 54 levels "03a3841a0f684ecd93995d985355da91",..: 1 2 3 4 5 6 7 8 9 10 ...
## $ avgTime_total: num 1.6 17.96 28.41 5.12 45.61 ...Alternative methods for calculating total average time using sequential modules
There are multiple possible methods to calculate an total average time a module was used by a student in the course, which may be tried by a someone trying to replicate this figure.
#Alternative Total Average Time Used Calculation
ddply(moduleUse,.(L2),summarize,
      totalTime = sum(totalTime,na.rm=T),
      meanUsers = mean(unq_stu,na.rm=T),
      avgTime_Total = totalTime/meanUsers)
Combining edX course chapter temporal completion estimates with chapters average time used by students
Now that the estimates of time to complete a sequential page and the total average time taken by students on sequential page modules can be combined into a single data frame.
The difference between the estimated times to completion and total average time taken by students with sequential pages is calculated. The value sign for each difference measurement (positive or negative) are created as factors used to assign color in the visualization.
## 'data.frame':    54 obs. of  12 variables:
##  $ id             : Factor w/ 735 levels "003a48b7833a46feb5b56a684a115796",..: 254 154 343 11 567 594 273 242 162 405 ...
##  $ parentID       : Factor w/ 184 levels "03a3841a0f684ecd93995d985355da91",..: 35 54 54 54 54 54 54 54 54 54 ...
##  $ order          : int  1 2 3 4 5 6 7 8 9 10 ...
##  $ label          : chr  "Pre-Assessment" "Welcome" "Course Schedule" "Course Collaboration Tools" ...
##  $ parentLabel    : chr  "Pre-Assessment" "Get Started" "Get Started" "Get Started" ...
##  $ unit           : chr  "m" "m" "m" "m" ...
##  $ pageEstTime_min: num  0 3 3 5 2 4 1 1 2 1 ...
##  $ pageEstTime_max: num  0 3 3 5 2 4 1 1 2 1 ...
##  $ chpEstTime_max : num  15 25 25 25 25 25 25 25 25 25 ...
##  $ avgTime_total  : num  29.169 10.697 20.872 17.957 0.924 ...
##  $ difTime        : num  29.17 7.7 17.87 12.96 -1.08 ...
##  $ sign           : Factor w/ 2 levels "Over Estimate",..: 2 2 2 2 1 2 2 2 2 2 ...
Visualization of Results
Setting up visualization themes and parameters
Before visualizing the results, themes for the visualization are set for the ggplot2 package.
#Theme for ggplot2
theme_set(theme_light())

#Univariate color scale
#Multi-color univariate color palette for the module type variables
#Dark blue to yellow green
pal1 <- function (n, h = c(360, 45), c. = c(100, 17), l = c(46, 93),
                  power = c(0, 0.866666666666667), fixup = TRUE, gamma = NULL,
                  alpha = 1, ...)
                  {
                    if (!is.null(gamma))
                      warning("'gamma' is deprecated and has no effect")
                    if (n < 1L)
                      return(character(0L))
                    h <- rep(h, length.out = 2L)
                    c <- rep(c., length.out = 2L)
                    l <- rep(l, length.out = 2L)
                    power <- rep(power, length.out = 2L)
                    rval <- seq(1, 0, length = n)
                    rval <- hex(polarLUV(L = l[2L] - diff(l) * rval^power[2L],
                                         C = c[2L] - diff(c) * rval^power[1L], H = h[2L] - diff(h) *
                                           rval), fixup = fixup, ...)
                    if (!missing(alpha)) {
                      alpha <- pmax(pmin(alpha, 1), 0)
                      alpha <- format(as.hexmode(round(alpha * 255 + 0.0001)),
                                      width = 2L, upper.case = TRUE)
                      rval <- paste(rval, alpha, sep = "")
                    }
                    return(rval)
}

#Categorical colors 2
catColors <- pal1(5)
Setting vertical lines used in the bar graph
chapterEst$parentID <- factor(chapterEst$parentID)
pageData$parentID <- factor(pageData$parentID)


#Sets Vertical Line Set for Page Modules by Week of course
vline <- as.data.frame(chapterEst[,c(1,3)])
names(vline)[2] <- 'label'
vline$mod <- 0
for(i in 1:nrow(vline)){
  vline[i,]$mod <- max(pageData[pageData$parentID==vline[i,1],]$order)+.5
}
Figure 2B
ggplot(pageData, aes(x=order, y=difTime)) +
  geom_bar(stat="identity",aes(fill=sign)) +
  geom_hline(yintercept=0, linetype=1, show.legend = NA)  +
  geom_vline(xintercept=vline[1:nrow(vline),3],linetype=5,alpha=.30) +
  scale_fill_manual(values=catColors[c(3,1)]) +
  scale_x_continuous(
    expand=c(0.005, 0.005),
    labels=pageEst$label,
    breaks=seq(1,max(pageEst$order),1)) +
  scale_y_continuous(breaks=seq(-20,round(max(pageData$difTime),0),20))+
  labs(#title="B",
       y="Difference in Time (Min.)",
       x="Course Page Module Sequence") +
  guides(fill = guide_legend(
            title = "Difference in Estimate",
            title.position = "top",
            title.theme = element_text(
              size = 10,
              angle = 0),
            label.theme = element_text(
              size = 8,
              angle = 0),
            reverse = TRUE
            )) +
  theme(axis.text.x = element_text(hjust=1,vjust=.25,size=10, angle=90),
        axis.ticks = element_blank(),
        panel.grid.major.x = element_blank(),
        panel.grid.minor.x = element_blank(),
        panel.grid.minor.y = element_blank(),
        panel.border = element_blank(),
        panel.grid.major.y = element_line(linetype = 4),
        legend.position = c(.95, .99),
        legend.justification = c("right", "top"),
        legend.box.just = "right",
        legend.margin = margin(0, 3, 0, 3))