Time & Date
April 11–16, 2021
Goals
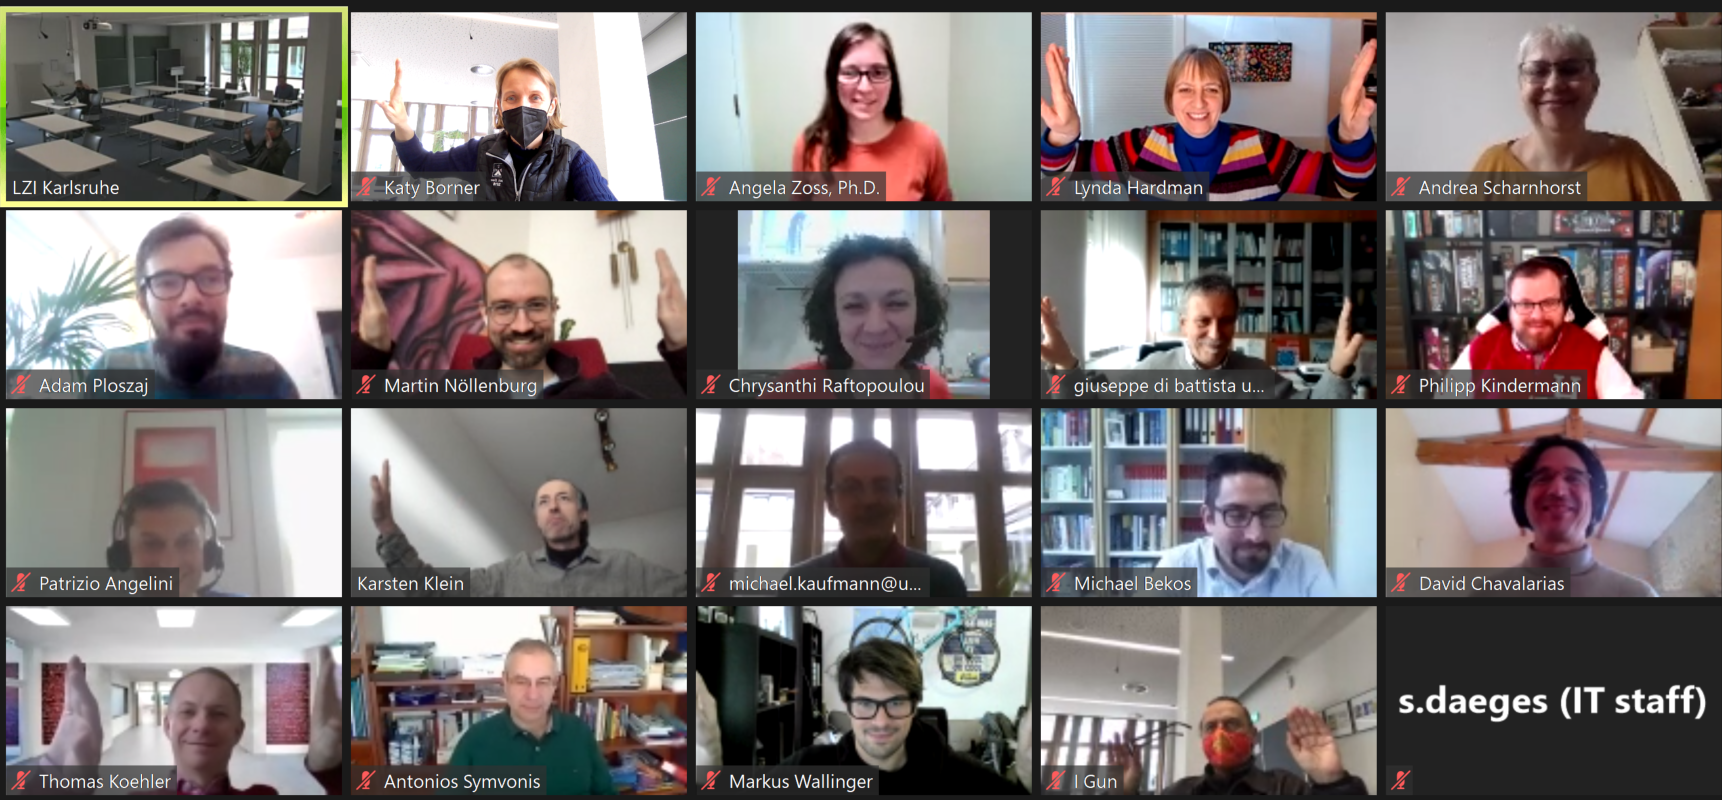
This Dagstuhl Seminar brought together researchers in cartography, information visualization, science of science, and graph drawing to discuss novel graph mining and layout algorithms and their application to the development of science mapping standards and services. We also organized an exhibition of art contributed by scientists and science maps contributed by artists, and used this to stimulate discussion.
Location
This was a hybrid event hosted by Schloss Dagstuhl
Participants
Organizers
Katy Börner
Director, CNS, Intelligent Systems Engineering, Indiana University
Stephen G. Kobourov
University of Arizona – Tucson, US
Agenda
All times were in Eastern Daylight Time (UTC-4)
Monday
9:00-09:15
Welcome by Katy Börner, Indiana University, USA: Welcome - SLIDES / VIDEO
9:15-10:00
Brief Introductions / Research Overviews
- Francis Harvey, Leibniz Institut für Länderkunde – Leipzig, DE:Current Research - SLIDES / VIDEO
- David Chavalarias, CNRS – Paris, FR: Complex Systems Computational Social Sciences, Cognitive Sciences - SLIDES / VIDEO
- Mohammad Khaledur Rahman, Indiana University, USA:“BatchLayout: A batch-parallel force-directed graph layout algorithm in shared memory” - SLIDES / VIDEO
10-10:30
Overview Talk
10:30-11:00
Coffee Break
11:00-12:00
Brief Introductions / Research Overviews
- Thomas Koehler, TU Dresden, DE - VIDEO
- Kilian Buehling, TU Dresden, DE: How Economics Incentives in Science Shape Knowledge Transfer and Knowledge Creation - VIDEO
- Andrea Scharnhorst, Royal Netherlands Academy of Arts and Sciences, NL: Data Archiving and Networked Services - SLIDES / VIDEO
- Alexander Wolff, University of Würzburg, DE: Using the Metro Map Metaphor for Drawing Hypergraphs - SLIDES / VIDEO
12:15-13:00
Lunch
14:00-15:00
Overview Talks
- Stephen Kobourov, University of Arizona, USA: Multi-Level Graph Representations - SLIDES / VIDEO
- Sara Fabrikant, Department of Geography, University of Zürich, CH: Cognitive Research on Landmarks, Color, Uncertainty & The Future of Geographic Information Displays - SLIDES / VIDEO
15:00-15:30
Coffee Break / Katy welcomes all to Amatria’s Virtual Birthday Party
15:30-16:30
Brief Introductions / Research Overviews
- Angela Zoss, Duke University, USA: Impact of Network Visualization Design and Context on User Interpretation - SLIDES / VIDEO
- Pino di Battista, Roma Tre University, IT: Research Overview - SLIDES / VIDEO
- Guy Melançon, Université de Bordeaux, France: Complex Networks - SLIDES / VIDEO
- Adam Ploszaj, University of Warsaw, PL: Scientific Collaboration - SLIDES / VIDEO
- Andreas Bueckle, IU, USA: Science Map Metaphors: A Comparison of Network Versus Hexmap-Based Visualizations - SLIDES / UCSD Map / VIDEO
16:30-18:00
Challenges & Opportunities and Discussion of Topics for Special Issue in IEEE Computer Graphics and Applications
18:00-19:00
Dinner
19:00-20:00
WEBINAR Special Event: Dagstuhl Exhibit Debut with Francis Harvey & Katy Börner - VIDEO
Tuesday
09:15-10:30
Research Talks
10:30-11:00
Coffee Break
11:00-12:00
Research Discussions
12:15-13:00
Lunch
14:00-15:00
Research Talks
15:00-15:30
Coffee Break
15:30-17:00
Open Problem Session, Discussion of Topics for Special Issue, Group Formation
18:00-19:00
Dinner
19:00-20:00
WEBINAR Special Event/Talk: David Chavalarias, ISC-PIF: Knowledge Dynamics Reconstruction + Gargantext - SLIDES / VIDEO
Wednesday
09:00-12:00
We five Dagstuhl participants will go on a walk or bike ride. Virtual participants self-organize!
12:15-13:00
Lunch
14:00-15:00
Meet in topic-specific writing groups for Special Issue
15:00-15:30
Coffee Break
15:30-17:00
Writing groups report back on planned papers for Special Issue
18:00-19:00
Dinner
19:00-20:00
WEBINAR Special Event/Talk: Kevin Boyack, SciTech Strategies: Creating, Visualizing and Accessing Global Models of Science: Scopus and PubMed - SLIDES / VIDEO
Thursday
09:00-09:30
Welcome and Debrief of Days 1-3 by Katy Börner
09:30-10:30
Research Talks
- Peter Sjögårde, Karolinska Institutet, SE: Visualizing a hierarchical classification of PubMed records - navigating from large disciplines to individual articles - https://petersjogarde.github.io/pm_classification/2021/research_areas/index.html - VIDEO
- Filipi Nascimento Silva, IU, USA: Rendering large networks with Helios + Fury - SLIDES / VIDEO
- Karsten Klein, Universität Konstanz, DE: Life Science Informatics - VIDEO
10:30-11:00
Coffee Break
11:00-12:00
Meet in topic-specific writing groups for Special Issue
12:15-13:00
Lunch
14:00-15:00
Meet in topic-specific writing groups for Special Issue - 2nd Best Idea
15:00-15:30
Coffee Break
15:30-17:00
Writing groups report back on planned papers for Special Issue
18:00-19:00
Dinner
19:00-20:00
WEBINAR Special Event/Talk: Ingo Günther, https://ingogunther.com/worldprocessor - VIDEO
Friday
09:00-09:30
Welcome and Debrief of Days 1-4 by Katy Börner
09:30-10:30
Agreeing on Topics for Special Issue
10:30-11:00
Coffee Break
11:00-12:00
Discussion of Next Steps
Noon
Adjourn
| 9:00-09:15 | Welcome by Katy Börner, Indiana University, USA: Welcome - SLIDES / VIDEO |
| 9:15-10:00 | Brief Introductions / Research Overviews
|
| 10-10:30 | Overview Talk |
| 10:30-11:00 | Coffee Break |
| 11:00-12:00 | Brief Introductions / Research Overviews
|
| 12:15-13:00 | Lunch |
| 14:00-15:00 | Overview Talks
|
| 15:00-15:30 | Coffee Break / Katy welcomes all to Amatria’s Virtual Birthday Party |
| 15:30-16:30 | Brief Introductions / Research Overviews
|
| 16:30-18:00 | Challenges & Opportunities and Discussion of Topics for Special Issue in IEEE Computer Graphics and Applications |
| 18:00-19:00 | Dinner |
| 19:00-20:00 | WEBINAR Special Event: Dagstuhl Exhibit Debut with Francis Harvey & Katy Börner - VIDEO |
| 09:15-10:30 | Research Talks |
| 10:30-11:00 | Coffee Break |
| 11:00-12:00 | Research Discussions |
| 12:15-13:00 | Lunch |
| 14:00-15:00 | Research Talks |
| 15:00-15:30 | Coffee Break |
| 15:30-17:00 | Open Problem Session, Discussion of Topics for Special Issue, Group Formation |
| 18:00-19:00 | Dinner |
| 19:00-20:00 | WEBINAR Special Event/Talk: David Chavalarias, ISC-PIF: Knowledge Dynamics Reconstruction + Gargantext - SLIDES / VIDEO |
| 09:00-12:00 | We five Dagstuhl participants will go on a walk or bike ride. Virtual participants self-organize! |
| 12:15-13:00 | Lunch |
| 14:00-15:00 | Meet in topic-specific writing groups for Special Issue |
| 15:00-15:30 | Coffee Break |
| 15:30-17:00 | Writing groups report back on planned papers for Special Issue |
| 18:00-19:00 | Dinner |
| 19:00-20:00 | WEBINAR Special Event/Talk: Kevin Boyack, SciTech Strategies: Creating, Visualizing and Accessing Global Models of Science: Scopus and PubMed - SLIDES / VIDEO |
| 09:00-09:30 | Welcome and Debrief of Days 1-3 by Katy Börner |
| 09:30-10:30 | Research Talks
|
| 10:30-11:00 | Coffee Break |
| 11:00-12:00 | Meet in topic-specific writing groups for Special Issue |
| 12:15-13:00 | Lunch |
| 14:00-15:00 | Meet in topic-specific writing groups for Special Issue - 2nd Best Idea |
| 15:00-15:30 | Coffee Break |
| 15:30-17:00 | Writing groups report back on planned papers for Special Issue |
| 18:00-19:00 | Dinner |
| 19:00-20:00 | WEBINAR Special Event/Talk: Ingo Günther, https://ingogunther.com/worldprocessor - VIDEO |
| 09:00-09:30 | Welcome and Debrief of Days 1-4 by Katy Börner |
| 09:30-10:30 | Agreeing on Topics for Special Issue |
| 10:30-11:00 | Coffee Break |
| 11:00-12:00 | Discussion of Next Steps |
| Noon | Adjourn |
Dagstuhl Exhibit
Event Media
Interviews
Ingo Günther: In this interview, longtime contributor to the Places & Spaces: Mapping Science exhibit Ingo Günther discusses his Worldprocessor project, the aesthetics of diplomacy, and scientometrics from an outsider perspective. Ingo also tells Todd about how art can function as an epistemological tool and why globes might be the ultimate macroscopes.(May 15)
David Chavalarias: In this interview, Todd Theriault talks with David Chavalarias, whose work has appeared in multiple iterations of the Places & Spaces: Mapping Science exhibit. David discusses his interest in tracking cultural evolution, what social data mining can tell us about political group formation, and how to pinpoint the moment health concerns enter the scientific discourse around a consumer product. (May 20)
Stephen Kobourov: In this interview, Stephen Kobourov, co-organizer of the 2021 Dagstuhl Seminar, talks about facilitating dialogue between theoreticians and practitioners, creating multi-level representations that behave like geographic maps, and why he’s kind of like the kid in The Sixth Sense. As a bonus, Stephen provides the clearest explanation of a Steiner tree that you’re likely to hear all year! (May 25)
Interviews conducted by Todd Theriault.Acknowledgements
This event was supported by the National Science Foundation under Grant No. DMS-1839167. Any opinions, findings, and conclusions or recommendations expressed in this material are those of the author(s) and do not necessarily reflect the views of the National Science Foundation.
Contact Us
Matthew MartindaleCyberinfrastructure for Network Science (CNS) Center Assistant
Luddy School of Informatics, Computing, and Engineering,
Indiana University
812-855-9930
masmarti@iu.edu
Social Media
Dagstuhl twitter feed: @dagstuhl
Share on TwitterHashtag: #computerscience