ㅤ
Companion Website for “Cell Type Populations for 3D Anatomical Structures of the Human Reference Atlas”
Andreas Bueckle1*, Bruce W. Herr II1*, Lu Chen2, Daniel Bolin1, Danial Qaurooni1, Michael Ginda1, Yashvardhan Jain1, Aleix Puig Barbe 3, Kristin Ardlie4, Fusheng Wang2, Katy Börner1*
1 Department of Intelligent Systems Engineering, Luddy School of Informatics, Computing, and Engineering, Indiana University, Bloomington, IN 47408, USA
2 Department of Computer Science and Department of Biomedical Informatics, Stony Brook University, Stony Brook, 11794, NY, USA
3 European Bioinformatics Institute (EMBL-EBI), Wellcome Genome Campus, Hinxton, Cambridge CB10 1SD, UK
4 Broad Institute, Cambridge, 02142, MA, USA
* Corresponding authors
abueckle@iu.edu
bherr@iu.edu
katy@iu.edu
Links
General
- Published paper in Nature Scientific Data
- GitHub repository for Supporting Information
- HuBMAP Publication page with links to all HuBMAP datasets, tissue, blocks, and donors used for HRApop v1.0
- HRA Portal
Portals
Code
Data
Figures
![]()
Figure C1. Mean scores for cell types (x-axis) from sc-transcriptomics datasets across organs and AS (y-axis) for (a) Azimuth, (b) CellTypist, and (c) popV.

Figure C2. Mean scores for cell types (x-axis) from sc-proteomics datasets across organs and AS (y-axis).
Usage examples
Accessing HRApop data via HRA API
A Jupyter Notebook detailing easy access to cell type populations for AS, extraction sites, and datasets is available at https://github.com/cns-iu/hra-cell-type-populations-supporting-information/blob/main/notebooks/hra-pop-grlc-queries.ipynb.
Visualizing Cell Type Populations for AS, ES, and Datasets
The HRApop Visualizer enables users to visualize stacked bar graphs for AS, ES, and Datasets, separated by sex and CTann tool. A video tutorial is available on YouTube and embedded below:
Step-by-step instructions
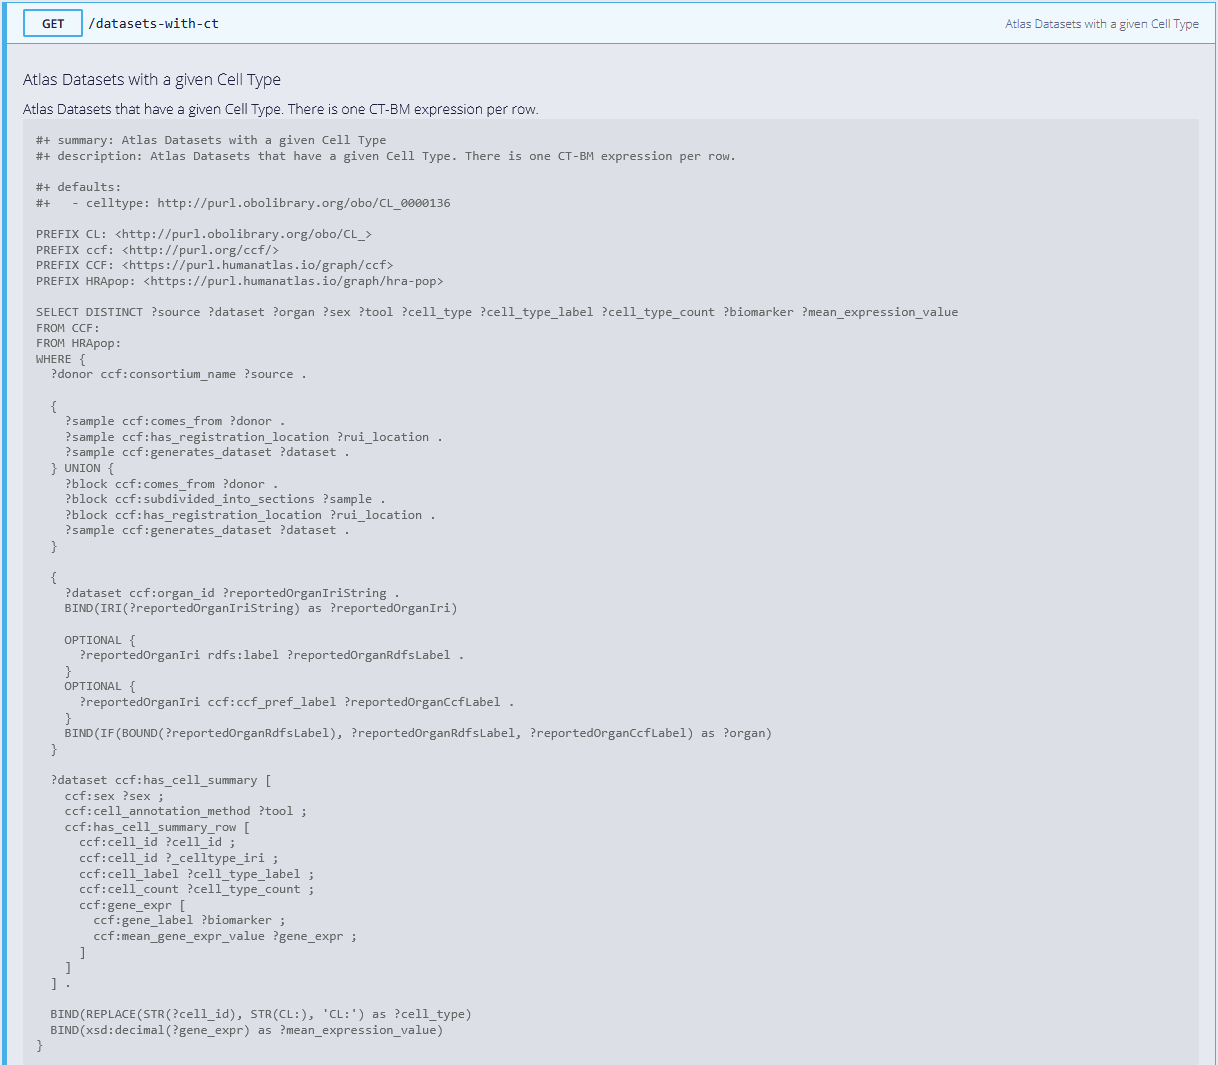
Goal: get mean biomarker expressions for a given CT in HRApop Atlas Datasets
-
When opening https://apps.humanatlas.io/api/grlc/hra-pop.html#get-/datasets-with-ct, the first item shown is the SPARQL query running when the endpoint is called:
-
Below, you can specify your request. The only mandatory field is the
celltype, which must be a Persistent URL (PURL). You can click the FILL EXAMPLE button to prefill this field withhttp://purl.obolibrary.org/obo/CL_0000136, which isadipocyte. Clickt the TRY button to run the query.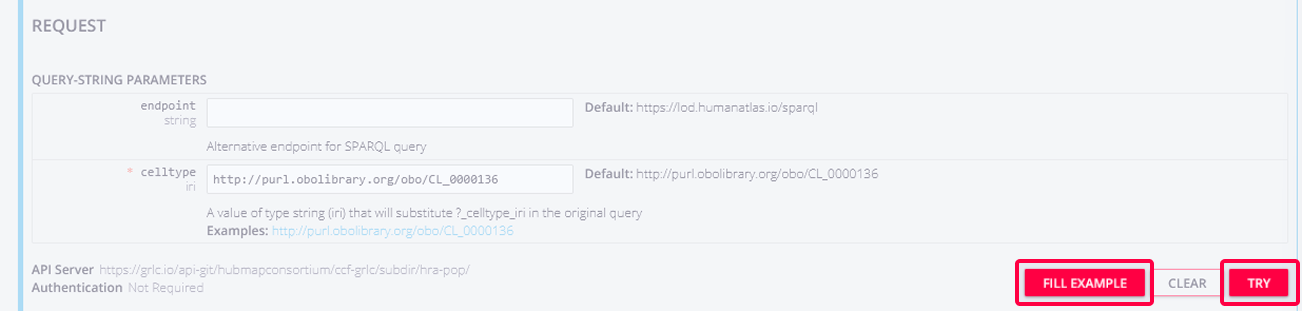
-
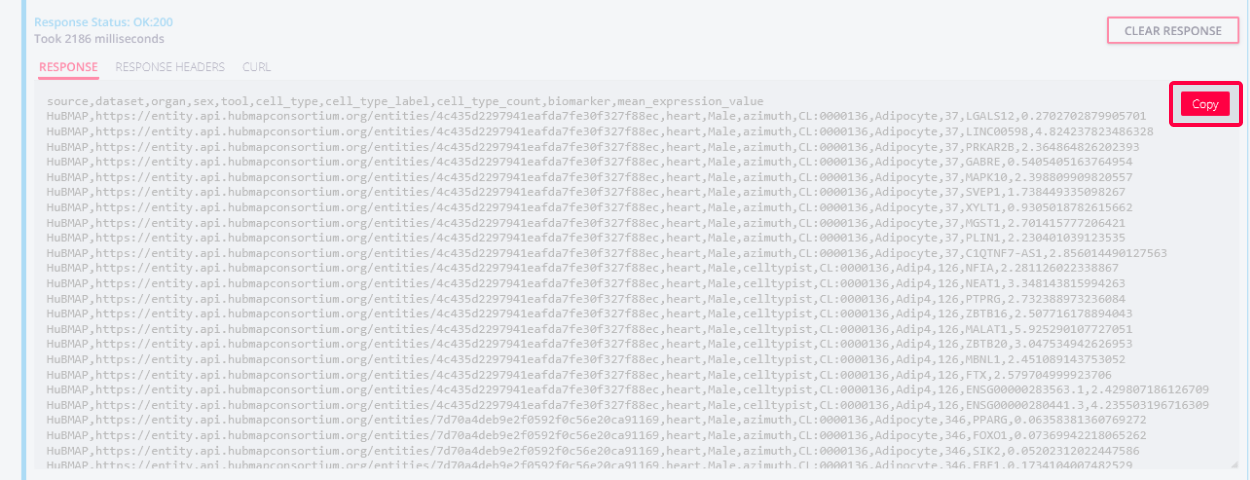
Then, the response area presents the result of the query, which consists of a table with one CT-B record per row. You may copy the results to your clipboard with the COPY button.
-
You can also click the tabs in the response area to get the
CURLcommand to run the query for the same results: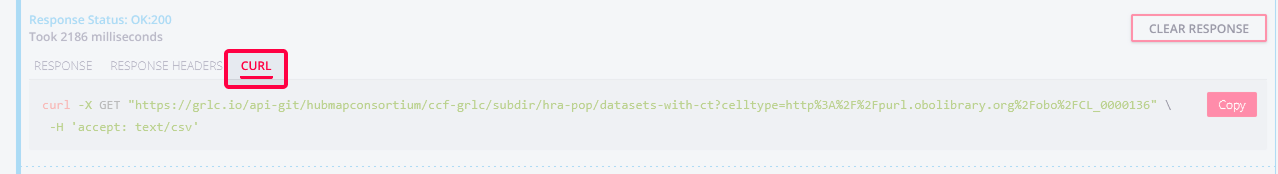
Interactive Sankey diagrams
In HRApop v1.0, 16,293 datasets served as Input for the RUI2CTpop Workflow, and they cover 49 organs. 662 datasets make up the HRApop Atlas. 5,672 datasets have an extraction site but no cell type population. Inversely, 6,395 datasets have a cell type population but no extraction site. 3,564 datasets have neither. The total number of non-atlas datasets is 15,631. The Sankey diagrams below offer an overview of HRApop provenance.
Explore the Sankey diagram for the Input for the DCTA Workflow below (embedded) or here.
Explore the Sankey diagram for HRApop ATlas Datasets below (embedded) or here.
HRApop Atlas Data extraction sites
Assigning a spatial location via the Registration User Interface (RUI, https://apps.humanatlas.io/rui) is an essential requirement for a dataset to be included in HRApop. Here is an instance of the Exploration User Interface that only shows extraction sites for HRApop Atlas Data. And here is the federated version with all registered tissue blocks.
z-scores for CTs per organ and AS
- High-resolution versions of the heatmaps are available here.
- The code to generate these heatmaps (exported to HTML) is here.
- The R Markdown notebook is here.
Exemplary corridor
Exemplary cell type populations
For a dataset
Shown is a snippet from a cell type population for a dataset in the small intestine, taken from a Dataset and Extraction Site Cell Type Population (DESpop). For clarity, we only show four CTs in this cell type population, all assigned by CellTypist, and we only show the top 10 Bs one CT (Tuft).
  {
        "@id": "https://entity.api.hubmapconsortium.org/entities/1628b6f7eb615862322d6274a6bc9fa0",
      "@type": "Donor",
      "samples": [
        {
          "@id": "https://entity.api.hubmapconsortium.org/entities/0b43d8d0dbbc5e3923a8b963650ab8e3",
          "@type": "Sample",
          "datasets": [],
          "sections": [
            {
              "@id": "https://entity.api.hubmapconsortium.org/entities/35e16f13caab262f446836f63cf4ad42",
              "@type": "Sample",
              "datasets": [
                {
                  "@id": "https://entity.api.hubmapconsortium.org/entities/3de525fe3e5718f297e8d62e037a042d",
                  "@type": "Dataset",
                  "link": "https://portal.hubmapconsortium.org/browse/dataset/3de525fe3e5718f297e8d62e037a042d",
                  "technology": "RNAseq",
                  "cell_count": "6000",
                  "gene_count": "60286",
                  "organ_id": "http://purl.obolibrary.org/obo/UBERON_0002108",
                  "label": "Registered 11/3/2023, HuBMAP Process, TMC-Stanford",
                  "description": "Dataset Type: RNAseq [Salmon]",
                  "thumbnail": "assets/icons/ico-unknown.svg",
                  "summaries": [
                    {
                      "@type": "CellSummary",
                      "annotation_method": "celltypist",
                      "modality": "sc_transcriptomics",
                      "summary": [
                        {
                          "cell_id": "ASCTB-TEMP:enterocyte",
                          "cell_label": "Enterocyte",
                          "gene_expr": [
                           ...
                          ],
                          "count": 3600,
                          "@type": "CellSummaryRow",
                          "percentage": 0.6
                        },
                        {
                          "cell_id": "ASCTB-TEMP:paneth",
                          "cell_label": "Paneth",
                          "gene_expr": [
                            ...
                            ],
                          "count": 265,
                          "@type": "CellSummaryRow",
                          "percentage": 0.04416666666666667
                        },
                        {
                          "cell_id": "ASCTB-TEMP:cycling-b-cell",
                          "cell_label": "Cycling B cell",
                          "gene_expr": [
                          ...
                          ],
                          "count": 43,
                          "@type": "CellSummaryRow",
                          "percentage": 0.007166666666666667
                        },
                        {
                          "cell_id": "ASCTB-TEMP:tuft",
                          "cell_label": "Tuft",
                          "gene_expr": [
                            {
                              "gene_id": "HGNC:29349",
                              "gene_label": "CCSER1",
                              "ensembl_id": "ENSG00000184305.15",
                              "mean_gene_expr_value": 3.573841094970703
                            },
                            {
                              "gene_id": "HGNC:18695",
                              "gene_label": "ST18",
                              "ensembl_id": "ENSG00000147488.11",
                              "mean_gene_expr_value": 2.0579261779785156
                            },
                            {
                              "gene_id": "HGNC:4036",
                              "gene_label": "FYB1",
                              "ensembl_id": "ENSG00000082074.18",
                              "mean_gene_expr_value": 2.106393337249756
                            },
                            {
                              "gene_id": "HGNC:10471",
                              "gene_label": "RUNX1",
                              "ensembl_id": "ENSG00000159216.19",
                              "mean_gene_expr_value": 2.0352487564086914
                            },
                            {
                              "gene_id": "HGNC:8783",
                              "gene_label": "PDE4D",
                              "ensembl_id": "ENSG00000113448.19",
                              "mean_gene_expr_value": 3.152188539505005
                            },
                            {
                              "gene_id": "HGNC:1079",
                              "gene_label": "BMX",
                              "ensembl_id": "ENSG00000102010.15",
                              "mean_gene_expr_value": 1.6486668586730957
                            },
                            {
                              "gene_id": "HGNC:13726",
                              "gene_label": "KMT2C",
                              "ensembl_id": "ENSG00000055609.19",
                              "mean_gene_expr_value": 2.2729785442352295
                            },
                            {
                              "gene_id": "HGNC:9066",
                              "gene_label": "PLCG2",
                              "ensembl_id": "ENSG00000197943.10",
                              "mean_gene_expr_value": 2.123337507247925
                            },
                            {
                              "gene_id": "HGNC:27363",
                              "gene_label": "ITPRID1",
                              "ensembl_id": "ENSG00000180347.13",
                              "mean_gene_expr_value": 1.7490202188491821
                            },
                            {
                              "gene_id": "HGNC:17890",
                              "gene_label": "HPGDS",
                              "ensembl_id": "ENSG00000163106.11",
                              "mean_gene_expr_value": 1.5961321592330933
                            }
                          ],
                          "count": 41,
                          "@type": "CellSummaryRow",
                          "percentage": 0.006833333333333334
                        }
	}
For an extraction site
Shown is a cell type population for an extraction site, taken from a Dataset and Extraction Site Cell Type Population (DESpop). All mesh-based collisions are listed in the all_collisions field. The corresponding corridor is described and linked in the corridor field. The summaries key contains the cell type population.
"rui_location": {
"@context": "https://hubmapconsortium.github.io/ccf-ontology/ccf-context.jsonld",
"@id": "http://purl.org/ccf/1.5/e240c0a4-5e53-4464-8320-ad775f2c4bf7",
"@type": "SpatialEntity",
"ccf_annotations": [
"http://purl.obolibrary.org/obo/UBERON_0002115",
"http://purl.obolibrary.org/obo/UBERON_0002116"
],
"creation_date": "2022-02-16",
"creator": "Yiing Lin",
"creator_first_name": "Yiing",
"creator_last_name": "Lin",
"dimension_units": "millimeter",
"placement": {
"@context": "https://hubmapconsortium.github.io/hubmap-ontology/ccf-context.jsonld",
"@id": "http://purl.org/ccf/1.5/e240c0a4-5e53-4464-8320-ad775f2c4bf7_placement",
"@type": "SpatialPlacement",
"placement_date": "2022-02-16",
"rotation_order": "XYZ",
"rotation_units": "degree",
"scaling_units": "ratio",
"target": "http://purl.org/ccf/latest/ccf.owl#VHFSmallIntestine",
"translation_units": "millimeter",
"x_rotation": 0,
"x_scaling": 1,
"x_translation": 130.806,
"y_rotation": 0,
"y_scaling": 1,
"y_translation": 111.09,
"z_rotation": 86,
"z_scaling": 1,
"z_translation": 54.023
},
"x_dimension": 3,
"y_dimension": 30,
"z_dimension": 15,
"all_collisions": [
{
"@type": "CollisionSummary",
"collision_method": "MESH",
"collisions": [
{
"@type": "CollisionItem",
"reference_organ": "http://purl.org/ccf/latest/ccf.owl#VHFSmallIntestine",
"as_3d_id": "https://purl.humanatlas.io/ref-organ/small-intestine-female/v1.2#VH_F_jejenum",
"as_id": "http://purl.obolibrary.org/obo/UBERON_0002115",
"as_label": "jejunum",
"as_volume": 28523.456808180017,
"percentage": 0.103
}
]
}
],
"corridor": {
"@type": "Corridor",
"file_format": "model/gltf-binary",
"file": "https://cdn.humanatlas.io/digital-objects/graph/hra-pop/v1.0/assets/corridors/e240c0a4-5e53-4464-8320-ad775f2c4bf7.glb"
},
"summaries": [
{
"@type": "CellSummary",
"sex": "Female",
"annotation_method": "celltypist",
"aggregated_summary_count": 1,
"aggregated_summaries": [
{
"aggregated_cell_source": "https://entity.api.hubmapconsortium.org/entities/3de525fe3e5718f297e8d62e037a042d",
"percentage": 1
}
],
"modality": "sc_transcriptomics",
"summary": [
{
"@type": "CellSummaryRow",
"cell_id": "ASCTB-TEMP:enterocyte",
"cell_label": "Enterocyte",
"count": 3598,
"percentage": 0.5996666666666667
},
{
"@type": "CellSummaryRow",
"cell_id": "ASCTB-TEMP:paneth",
"cell_label": "Paneth",
"count": 265,
"percentage": 0.04416666666666667
},
{
"@type": "CellSummaryRow",
"cell_id": "ASCTB-TEMP:cycling-b-cell",
"cell_label": "Cycling B cell",
"count": 43,
"percentage": 0.007166666666666667
},
{
"@type": "CellSummaryRow",
"cell_id": "ASCTB-TEMP:tuft",
"cell_label": "Tuft",
"count": 41,
"percentage": 0.006833333333333334
},
{
"@type": "CellSummaryRow",
"cell_id": "ASCTB-TEMP:trgv2-gdt",
"cell_label": "TRGV2 gdT",
"count": 120,
"percentage": 0.02
},
{
"@type": "CellSummaryRow",
"cell_id": "ASCTB-TEMP:stem-cells",
"cell_label": "Stem cells",
"count": 110,
"percentage": 0.018333333333333333
},
{
"@type": "CellSummaryRow",
"cell_id": "ASCTB-TEMP:best4-epithelial",
"cell_label": "BEST4+ epithelial",
"count": 124,
"percentage": 0.020666666666666667
},
{
"@type": "CellSummaryRow",
"cell_id": "ASCTB-TEMP:goblet-cell",
"cell_label": "Goblet cell",
"count": 289,
"percentage": 0.04816666666666667
},
{
"@type": "CellSummaryRow",
"cell_id": "ASCTB-TEMP:myofibroblast",
"cell_label": "myofibroblast",
"count": 57,
"percentage": 0.0095
},
{
"@type": "CellSummaryRow",
"cell_id": "ASCTB-TEMP:eecs",
"cell_label": "EECs",
"count": 251,
"percentage": 0.041833333333333333
},
{
"@type": "CellSummaryRow",
"cell_id": "ASCTB-TEMP:activated-t",
"cell_label": "Activated T",
"count": 47,
"percentage": 0.007833333333333333
},
{
"@type": "CellSummaryRow",
"cell_id": "ASCTB-TEMP:mature-arterial-ec",
"cell_label": "Mature arterial EC",
"count": 11,
"percentage": 0.0018333333333333333
},
{
"@type": "CellSummaryRow",
"cell_id": "ASCTB-TEMP:branch-a1-imn-",
"cell_label": "Branch A1 (iMN)",
"count": 3,
"percentage": 0.0005
},
{
"@type": "CellSummaryRow",
"cell_id": "ASCTB-TEMP:memory-b",
"cell_label": "Memory B",
"count": 13,
"percentage": 0.0021666666666666666
},
{
"@type": "CellSummaryRow",
"cell_id": "ASCTB-TEMP:mesoderm-1-hand1-",
"cell_label": "Mesoderm 1 (HAND1+)",
"count": 5,
"percentage": 0.0008333333333333334
},
{
"@type": "CellSummaryRow",
"cell_id": "ASCTB-TEMP:stat1-naive-b",
"cell_label": "STAT1+ Naive B",
"count": 21,
"percentage": 0.0035
},
{
"@type": "CellSummaryRow",
"cell_id": "ASCTB-TEMP:microfold-cell",
"cell_label": "Microfold cell",
"count": 198,
"percentage": 0.033
},
{
"@type": "CellSummaryRow",
"cell_id": "ASCTB-TEMP:proximal-progenitor",
"cell_label": "Proximal progenitor",
"count": 106,
"percentage": 0.017666666666666667
},
{
"@type": "CellSummaryRow",
"cell_id": "ASCTB-TEMP:stromal-1-ccl11-",
"cell_label": "Stromal 1 (CCL11+)",
"count": 23,
"percentage": 0.003833333333333333
},
{
"@type": "CellSummaryRow",
"cell_id": "ASCTB-TEMP:branch-b1-emn-",
"cell_label": "Branch B1 (eMN)",
"count": 31,
"percentage": 0.005166666666666667
},
{
"@type": "CellSummaryRow",
"cell_id": "ASCTB-TEMP:stromal-2-npy-",
"cell_label": "Stromal 2 (NPY+)",
"count": 12,
"percentage": 0.002
},
{
"@type": "CellSummaryRow",
"cell_id": "ASCTB-TEMP:ec-cells-tac1-",
"cell_label": "EC cells (TAC1+)",
"count": 20,
"percentage": 0.0033333333333333335
},
{
"@type": "CellSummaryRow",
"cell_id": "ASCTB-TEMP:i-cells-cck-",
"cell_label": "I cells (CCK+)",
"count": 26,
"percentage": 0.004333333333333333
},
{
"@type": "CellSummaryRow",
"cell_id": "ASCTB-TEMP:smc-part1-capn3-",
"cell_label": "SMC (PART1/CAPN3+)",
"count": 6,
"percentage": 0.001
},
{
"@type": "CellSummaryRow",
"cell_id": "ASCTB-TEMP:arterial-capillary",
"cell_label": "arterial capillary",
"count": 30,
"percentage": 0.005
},
{
"@type": "CellSummaryRow",
"cell_id": "ASCTB-TEMP:lyve1-macrophage",
"cell_label": "LYVE1+ Macrophage",
"count": 18,
"percentage": 0.003
},
{
"@type": "CellSummaryRow",
"cell_id": "ASCTB-TEMP:m-x-cells-mln-ghrl-",
"cell_label": "M/X cells (MLN/GHRL+)",
"count": 12,
"percentage": 0.002
},
{
"@type": "CellSummaryRow",
"cell_id": "ASCTB-TEMP:tfh",
"cell_label": "Tfh",
"count": 33,
"percentage": 0.0055
},
{
"@type": "CellSummaryRow",
"cell_id": "ASCTB-TEMP:stromal-3-kcnn3-",
"cell_label": "Stromal 3 (KCNN3+)",
"count": 18,
"percentage": 0.003
},
{
"@type": "CellSummaryRow",
"cell_id": "ASCTB-TEMP:mlto",
"cell_label": "mLTo",
"count": 5,
"percentage": 0.0008333333333333334
},
{
"@type": "CellSummaryRow",
"cell_id": "ASCTB-TEMP:lec6-adamts4-",
"cell_label": "LEC6 (ADAMTS4+)",
"count": 2,
"percentage": 0.0003333333333333333
},
{
"@type": "CellSummaryRow",
"cell_id": "ASCTB-TEMP:glia-1-dhh-",
"cell_label": "Glia 1 (DHH+)",
"count": 2,
"percentage": 0.0003333333333333333
},
{
"@type": "CellSummaryRow",
"cell_id": "ASCTB-TEMP:cycling-ec",
"cell_label": "cycling EC",
"count": 20,
"percentage": 0.0033333333333333335
},
{
"@type": "CellSummaryRow",
"cell_id": "ASCTB-TEMP:d-cells-sst-",
"cell_label": "D cells (SST+)",
"count": 10,
"percentage": 0.0016666666666666668
},
{
"@type": "CellSummaryRow",
"cell_id": "ASCTB-TEMP:myofibroblast-rspo2-",
"cell_label": "myofibroblast (RSPO2+)",
"count": 30,
"percentage": 0.005
},
{
"@type": "CellSummaryRow",
"cell_id": "ASCTB-TEMP:contractile-pericyte-pln-",
"cell_label": "Contractile pericyte (PLN+)",
"count": 20,
"percentage": 0.0033333333333333335
},
{
"@type": "CellSummaryRow",
"cell_id": "ASCTB-TEMP:t-reticular",
"cell_label": "T reticular",
"count": 5,
"percentage": 0.0008333333333333334
},
{
"@type": "CellSummaryRow",
"cell_id": "ASCTB-TEMP:colonocyte",
"cell_label": "Colonocyte",
"count": 4,
"percentage": 0.0006666666666666666
},
{
"@type": "CellSummaryRow",
"cell_id": "ASCTB-TEMP:cd8-tmem",
"cell_label": "CD8 Tmem",
"count": 7,
"percentage": 0.0011666666666666668
},
{
"@type": "CellSummaryRow",
"cell_id": "ASCTB-TEMP:cycling-plasma-cell",
"cell_label": "Cycling plasma cell",
"count": 28,
"percentage": 0.004666666666666667
},
{
"@type": "CellSummaryRow",
"cell_id": "ASCTB-TEMP:lec4-stab2-",
"cell_label": "LEC4 (STAB2+)",
"count": 10,
"percentage": 0.0016666666666666668
},
{
"@type": "CellSummaryRow",
"cell_id": "ASCTB-TEMP:dz-gc-cell",
"cell_label": "DZ GC cell",
"count": 16,
"percentage": 0.0026666666666666666
},
{
"@type": "CellSummaryRow",
"cell_id": "ASCTB-TEMP:angiogenic-pericyte",
"cell_label": "angiogenic pericyte",
"count": 2,
"percentage": 0.0003333333333333333
},
{
"@type": "CellSummaryRow",
"cell_id": "ASCTB-TEMP:fdc",
"cell_label": "FDC",
"count": 4,
"percentage": 0.0006666666666666666
},
{
"@type": "CellSummaryRow",
"cell_id": "ASCTB-TEMP:stromal-3-c7-",
"cell_label": "Stromal 3 (C7+)",
"count": 13,
"percentage": 0.0021666666666666666
},
{
"@type": "CellSummaryRow",
"cell_id": "ASCTB-TEMP:progenitor-neurog3-",
"cell_label": "Progenitor (NEUROG3+)",
"count": 12,
"percentage": 0.002
},
{
"@type": "CellSummaryRow",
"cell_id": "ASCTB-TEMP:pdc",
"cell_label": "pDC",
"count": 5,
"percentage": 0.0008333333333333334
},
{
"@type": "CellSummaryRow",
"cell_id": "ASCTB-TEMP:mature-venous-ec",
"cell_label": "Mature venous EC",
"count": 21,
"percentage": 0.0035
},
{
"@type": "CellSummaryRow",
"cell_id": "ASCTB-TEMP:lti-like-ncr-ilc3",
"cell_label": "LTi-like NCR- ILC3",
"count": 6,
"percentage": 0.001
},
{
"@type": "CellSummaryRow",
"cell_id": "ASCTB-TEMP:mait-cell",
"cell_label": "MAIT cell",
"count": 2,
"percentage": 0.0003333333333333333
},
{
"@type": "CellSummaryRow",
"cell_id": "ASCTB-TEMP:trdv2-trgv9-gdt",
"cell_label": "TRDV2/TRGV9 gdT",
"count": 19,
"percentage": 0.0031666666666666666
},
{
"@type": "CellSummaryRow",
"cell_id": "ASCTB-TEMP:nk-cell",
"cell_label": "NK cell",
"count": 25,
"percentage": 0.004166666666666667
},
{
"@type": "CellSummaryRow",
"cell_id": "ASCTB-TEMP:glia-3-bcan-",
"cell_label": "Glia 3 (BCAN+)",
"count": 7,
"percentage": 0.0011666666666666668
},
{
"@type": "CellSummaryRow",
"cell_id": "ASCTB-TEMP:activated-cd8-t",
"cell_label": "Activated CD8 T",
"count": 2,
"percentage": 0.0003333333333333333
},
{
"@type": "CellSummaryRow",
"cell_id": "ASCTB-TEMP:neuroblast",
"cell_label": "Neuroblast",
"count": 1,
"percentage": 0.00016666666666666666
},
{
"@type": "CellSummaryRow",
"cell_id": "ASCTB-TEMP:distal-progenitor",
"cell_label": "Distal progenitor",
"count": 3,
"percentage": 0.0005
},
{
"@type": "CellSummaryRow",
"cell_id": "ASCTB-TEMP:macrophages",
"cell_label": "Macrophages",
"count": 15,
"percentage": 0.0025
},
{
"@type": "CellSummaryRow",
"cell_id": "ASCTB-TEMP:mast-cell",
"cell_label": "Mast cell",
"count": 3,
"percentage": 0.0005
},
{
"@type": "CellSummaryRow",
"cell_id": "ASCTB-TEMP:trgv4-gdt",
"cell_label": "TRGV4 gdT",
"count": 22,
"percentage": 0.0036666666666666666
},
{
"@type": "CellSummaryRow",
"cell_id": "ASCTB-TEMP:icc",
"cell_label": "ICC",
"count": 1,
"percentage": 0.00016666666666666666
},
{
"@type": "CellSummaryRow",
"cell_id": "ASCTB-TEMP:k-cells-gip-",
"cell_label": "K cells (GIP+)",
"count": 8,
"percentage": 0.0013333333333333333
},
{
"@type": "CellSummaryRow",
"cell_id": "ASCTB-TEMP:pre-b",
"cell_label": "Pre-B",
"count": 7,
"percentage": 0.0011666666666666668
},
{
"@type": "CellSummaryRow",
"cell_id": "ASCTB-TEMP:l-cells-pyy-",
"cell_label": "L cells (PYY+)",
"count": 11,
"percentage": 0.0018333333333333333
},
{
"@type": "CellSummaryRow",
"cell_id": "ASCTB-TEMP:smc-plpp2-",
"cell_label": "SMC (PLPP2+)",
"count": 16,
"percentage": 0.0026666666666666666
},
{
"@type": "CellSummaryRow",
"cell_id": "ASCTB-TEMP:adult-glia",
"cell_label": "Adult Glia",
"count": 10,
"percentage": 0.0016666666666666668
},
{
"@type": "CellSummaryRow",
"cell_id": "ASCTB-TEMP:th1",
"cell_label": "Th1",
"count": 4,
"percentage": 0.0006666666666666666
},
{
"@type": "CellSummaryRow",
"cell_id": "ASCTB-TEMP:branch-b3-ipan-",
"cell_label": "Branch B3 (IPAN)",
"count": 2,
"percentage": 0.0003333333333333333
},
{
"@type": "CellSummaryRow",
"cell_id": "ASCTB-TEMP:ta",
"cell_label": "TA",
"count": 13,
"percentage": 0.0021666666666666666
},
{
"@type": "CellSummaryRow",
"cell_id": "ASCTB-TEMP:sell-cd4-t",
"cell_label": "SELL+ CD4 T",
"count": 2,
"percentage": 0.0003333333333333333
},
{
"@type": "CellSummaryRow",
"cell_id": "ASCTB-TEMP:branch-a2-ipan-in-",
"cell_label": "Branch A2 (IPAN/IN)",
"count": 8,
"percentage": 0.0013333333333333333
},
{
"@type": "CellSummaryRow",
"cell_id": "ASCTB-TEMP:immature-pericyte",
"cell_label": "Immature pericyte",
"count": 4,
"percentage": 0.0006666666666666666
},
{
"@type": "CellSummaryRow",
"cell_id": "ASCTB-TEMP:clp",
"cell_label": "CLP",
"count": 3,
"percentage": 0.0005
},
{
"@type": "CellSummaryRow",
"cell_id": "ASCTB-TEMP:cycling-stromal",
"cell_label": "cycling stromal",
"count": 1,
"percentage": 0.00016666666666666666
},
{
"@type": "CellSummaryRow",
"cell_id": "ASCTB-TEMP:transitional-stromal-3-c3-",
"cell_label": "Transitional Stromal 3 (C3+)",
"count": 3,
"percentage": 0.0005
},
{
"@type": "CellSummaryRow",
"cell_id": "ASCTB-TEMP:branch-a4-in-",
"cell_label": "Branch A4 (IN)",
"count": 5,
"percentage": 0.0008333333333333334
},
{
"@type": "CellSummaryRow",
"cell_id": "ASCTB-TEMP:lec1-ackr4-",
"cell_label": "LEC1 (ACKR4+)",
"count": 1,
"percentage": 0.00016666666666666666
},
{
"@type": "CellSummaryRow",
"cell_id": "ASCTB-TEMP:lec3-adgrg3-",
"cell_label": "LEC3 (ADGRG3+)",
"count": 2,
"percentage": 0.0003333333333333333
},
{
"@type": "CellSummaryRow",
"cell_id": "ASCTB-TEMP:monocytes",
"cell_label": "Monocytes",
"count": 3,
"percentage": 0.0005
},
{
"@type": "CellSummaryRow",
"cell_id": "ASCTB-TEMP:sell-cd8-t",
"cell_label": "SELL+ CD8 T",
"count": 2,
"percentage": 0.0003333333333333333
},
{
"@type": "CellSummaryRow",
"cell_id": "ASCTB-TEMP:-cells-ins-",
"cell_label": "β cells (INS+)",
"count": 1,
"percentage": 0.00016666666666666666
},
{
"@type": "CellSummaryRow",
"cell_id": "ASCTB-TEMP:mesothelium-rgs5-",
"cell_label": "Mesothelium (RGS5+)",
"count": 2,
"percentage": 0.0003333333333333333
},
{
"@type": "CellSummaryRow",
"cell_id": "ASCTB-TEMP:nk-t-cell",
"cell_label": "NK T cell",
"count": 2,
"percentage": 0.0003333333333333333
},
{
"@type": "CellSummaryRow",
"cell_id": "ASCTB-TEMP:activated-cd4-t",
"cell_label": "Activated CD4 T",
"count": 2,
"percentage": 0.0003333333333333333
},
{
"@type": "CellSummaryRow",
"cell_id": "ASCTB-TEMP:pericyte",
"cell_label": "Pericyte",
"count": 3,
"percentage": 0.0005
},
{
"@type": "CellSummaryRow",
"cell_id": "ASCTB-TEMP:fetal-venous-ec",
"cell_label": "Fetal venous EC",
"count": 4,
"percentage": 0.0006666666666666666
},
{
"@type": "CellSummaryRow",
"cell_id": "ASCTB-TEMP:fcrl4-memory-b",
"cell_label": "FCRL4+ Memory B",
"count": 3,
"percentage": 0.0005
},
{
"@type": "CellSummaryRow",
"cell_id": "ASCTB-TEMP:cdc1",
"cell_label": "cDC1",
"count": 3,
"percentage": 0.0005
},
{
"@type": "CellSummaryRow",
"cell_id": "ASCTB-TEMP:lz-gc-cell",
"cell_label": "LZ GC cell",
"count": 2,
"percentage": 0.0003333333333333333
},
{
"@type": "CellSummaryRow",
"cell_id": "ASCTB-TEMP:gc-b-cell",
"cell_label": "GC B cell",
"count": 2,
"percentage": 0.0003333333333333333
},
{
"@type": "CellSummaryRow",
"cell_id": "ASCTB-TEMP:venous-capillary",
"cell_label": "venous capillary",
"count": 1,
"percentage": 0.00016666666666666666
},
{
"@type": "CellSummaryRow",
"cell_id": "ASCTB-TEMP:cldn10-cells",
"cell_label": "CLDN10+ cells",
"count": 1,
"percentage": 0.00016666666666666666
},
{
"@type": "CellSummaryRow",
"cell_id": "ASCTB-TEMP:lymphoid-dc",
"cell_label": "Lymphoid DC",
"count": 1,
"percentage": 0.00016666666666666666
},
{
"@type": "CellSummaryRow",
"cell_id": "ASCTB-TEMP:mmp9-inflammatory-macrophage",
"cell_label": "MMP9+ Inflammatory macrophage",
"count": 1,
"percentage": 0.00016666666666666666
},
{
"@type": "CellSummaryRow",
"cell_id": "ASCTB-TEMP:pro-b",
"cell_label": "Pro-B",
"count": 1,
"percentage": 0.00016666666666666666
},
{
"@type": "CellSummaryRow",
"cell_id": "ASCTB-TEMP:branch-b2-emn-",
"cell_label": "Branch B2 (eMN)",
"count": 3,
"percentage": 0.0005
},
{
"@type": "CellSummaryRow",
"cell_id": "ASCTB-TEMP:naive-b",
"cell_label": "Naive B",
"count": 3,
"percentage": 0.0005
},
{
"@type": "CellSummaryRow",
"cell_id": "ASCTB-TEMP:treg",
"cell_label": "Treg",
"count": 2,
"percentage": 0.0003333333333333333
},
{
"@type": "CellSummaryRow",
"cell_id": "ASCTB-TEMP:stromal-2-ch25h-",
"cell_label": "Stromal 2 (CH25H+)",
"count": 1,
"percentage": 0.00016666666666666666
},
{
"@type": "CellSummaryRow",
"cell_id": "ASCTB-TEMP:best2-goblet-cell",
"cell_label": "BEST2+ Goblet cell",
"count": 1,
"percentage": 0.00016666666666666666
},
{
"@type": "CellSummaryRow",
"cell_id": "ASCTB-TEMP:lec2-madcam1-",
"cell_label": "LEC2 (MADCAM1+)",
"count": 1,
"percentage": 0.00016666666666666666
},
{
"@type": "CellSummaryRow",
"cell_id": "ASCTB-TEMP:ilc2",
"cell_label": "ILC2",
"count": 1,
"percentage": 0.00016666666666666666
},
{
"@type": "CellSummaryRow",
"cell_id": "ASCTB-TEMP:stromal-1-adamdec1-",
"cell_label": "Stromal 1 (ADAMDEC1+)",
"count": 1,
"percentage": 0.00016666666666666666
}
]
},
{
"@type": "CellSummary",
"sex": "Female",
"annotation_method": "popv",
"aggregated_summary_count": 1,
"aggregated_summaries": [
{
"aggregated_cell_source": "https://entity.api.hubmapconsortium.org/entities/3de525fe3e5718f297e8d62e037a042d",
"percentage": 1
}
],
"modality": "sc_transcriptomics",
"summary": [
{
"@type": "CellSummaryRow",
"cell_id": "CL:1000334",
"cell_label": "enterocyte of epithelium of small intestine",
"count": 5408,
"percentage": 0.9016338779593198
},
{
"@type": "CellSummaryRow",
"cell_id": "CL:1000343",
"cell_label": "paneth cell of epithelium of small intestine",
"count": 192,
"percentage": 0.032010670223407804
},
{
"@type": "CellSummaryRow",
"cell_id": "CL:1000495",
"cell_label": "small intestine goblet cell",
"count": 215,
"percentage": 0.035845281760586864
},
{
"@type": "CellSummaryRow",
"cell_id": "CL:0009006",
"cell_label": "intestinal enteroendocrine cell",
"count": 44,
"percentage": 0.007335778592864288
},
{
"@type": "CellSummaryRow",
"cell_id": "CL:0009012",
"cell_label": "transit amplifying cell of small intestine",
"count": 10,
"percentage": 0.0016672224074691564
},
{
"@type": "CellSummaryRow",
"cell_id": "CL:0009080",
"cell_label": "intestinal tuft cell",
"count": 26,
"percentage": 0.004334778259419807
},
{
"@type": "CellSummaryRow",
"cell_id": "CL:0000057",
"cell_label": "fibroblast",
"count": 41,
"percentage": 0.006835611870623541
},
{
"@type": "CellSummaryRow",
"cell_id": "CL:0000131",
"cell_label": "gut endothelial cell",
"count": 14,
"percentage": 0.002334111370456819
},
{
"@type": "CellSummaryRow",
"cell_id": "CL:0000775",
"cell_label": "neutrophil",
"count": 38,
"percentage": 0.006335445148382794
},
{
"@type": "CellSummaryRow",
"cell_id": "CL:0000624",
"cell_label": "CD4-positive, alpha-beta T cell",
"count": 1,
"percentage": 0.00016672224074691563
},
{
"@type": "CellSummaryRow",
"cell_id": "CL:0000625",
"cell_label": "CD8-positive, alpha-beta T cell",
"count": 6,
"percentage": 0.0010003334444814939
},
{
"@type": "CellSummaryRow",
"cell_id": "CL:0000786",
"cell_label": "plasma cell",
"count": 3,
"percentage": 0.0005001667222407469
}
]
}
]
}
For an AS
Shown is a snippet from the AS Cell Type Population of the cortex of kidney, assigned by Azimuth, taken from a AS Cell Type Population (ASpop).
  {
      "@type": "CellSummary",
      "sex": "Female",
      "cell_source": "http://purl.obolibrary.org/obo/UBERON_0002189",
      "cell_source_label": "outer cortex of kidney",
      "annotation_method": "azimuth",
      "aggregated_summary_count": 37,
      "aggregated_summaries": [
        {
          "aggregated_cell_source": "https://entity.api.hubmapconsortium.org/entities/367fee3b40cba682063289505b922be1",
          "percentage": 0.981
        },
        {
          "aggregated_cell_source": "https://entity.api.hubmapconsortium.org/entities/434fbc55d458dc4e06da9ba4961f3840",
          "percentage": 0.343
        },
        ...],
      "modality": "sc_transcriptomics",
      "summary": [
        {
          "@type": "CellSummaryRow",
          "cell_id": "CL:1000692",
          "cell_label": "Fibroblast",
          "count": 10336.100000000002,
          "percentage": 0.01925307293655101
        },
        {
          "@type": "CellSummaryRow",
          "cell_id": "CL:1001108",
          "cell_label": "Medullary Thick Ascending Limb",
          "count": 26758.349000000002,
          "percentage": 0.04984282707778434
        },
        {
          "@type": "CellSummaryRow",
          "cell_id": "CL:4030013",
          "cell_label": "Descending Thin Limb Type 2",
          "count": 31925.262000000002,
          "percentage": 0.05946724565401847
        }
        ...
	}
Outlook
To improve coverage and quality of HRApop, the following steps are planned:
Long-term sustainability: The HRA and, by extension, HRApop is currently funded via the HuBMAP, SenNet, KPMP, Common Fund Data Ecosystem (CFDE), GTEx, and NIDDK. Funding that has been acquired since HRApop v1.0 was released comes via the Whole Person Reference Physiome Research and Coordination Center (WPP, 1U24AT013504-01), the Canadian Institute for Advanced Research (CIFAR) MacMillan Multiscale Human (cifar.ca/research-programs/cifar-macmillan-multiscale-human), and the Stiftung Charité via Berlin Institute of Health at Charité (BIH). This funding supports regular HRApop releases, with data products made available via Zenodo1 and the HRA KG2 (lod.humanatlas.io/graph/hra-pop).
Increase number of RUI registered datasets: As of January 2026, the HuBMAP and SenNet portals list 908 and 172 datasets with 3D extraction sites that are currently in QA/QC status but will be published soon. Outreach efforts to authors of peer-reviewed, published papers are ongoing to register their data for use in the DCTA Workflow. The HRApop effort will also integrate data from Tabula Sapiens3, KPMP, the Helmsley Gut Cell Atlas4, and the Deeply Integrated human Single-Cell Omics (DISCO) database5, which has a total of 21,330 datasets, out of which 32.8% of the total data is from a healthy human body, across 166 unique ASs. Other potential sources for high-quality datasets have been captured in Hemberg et al.’s recent article on large cell atlases6.
Scale up tissue registration via millitomes: A millitome7 (from Latin mille, meaning “thousand,” and the Greek temnein, meaning “to cut”) is a device designed to hold a freshly procured organ and facilitate cutting it into many small tissue blocks of well defined size for usage in sc-analysis and HRA construction. It is used to produce uniformly sized slices or cubes of tissue material that can be registered to 3D reference objects. Using a millitome improves efficiency by enabling consistent, high-throughput sampling. Recently, 209 brain tissue blocks have been added and will be included in the next HRApop run after the 10th HRA release.
Improve generalizability: The 104 sc-proteomics datasets in HRApop v1.0 were presented as a generalization from sc-transcriptomics datasets. In the future, and in synergy with HRA Vasculature Common Coordinate Framework (VCCF) construction efforts8,9 around endothelial cell environments10, more CODEX11 datasets and new modalities, such as the Spatial Multiomics Single-Cell Imaging platform CosMx12, will be added to HRApop. A recent paper10 analyzed 399 spatially resolved omics datasets from 14 studies comprising 12 tissue types with a total of 47,349,496.
Increase number of CTann tools used to enable more benchmarking: Currently, HRApop uses three well-established CTann tools backed by scientific publications describing the methods, results, and validations for each tool. Results are presented as CT populations by CTann tool—users can pick their favorite tool and data or perform comparisons and benchmarks between CTann tools13. Future HRA releases will feature additional CTann tools such as FR-Match14 and Pan-Human Azimuth (satijalab.org/pan_human_azimuth) in support of improved cell type annotation, CTann tool comparisons and benchmarking.
Add biomarker sets: For HRApop v1.0, the top biomarkers per CT per dataset were computed using scanpy’s rank_gene_groups() method (scanpy.readthedocs.io/en/stable/generated/scanpy.tl.rank_genes_groups.html). In future HRApop releases, additional sets of top biomarkers will be provided to the user by running, e.g., NS-Forest15 during the annotation phase of the DCTA.
Decrease run time for HRApop code: As explained in the manuscript, for HRApop v1.0, the DCTA Workflow started on Thu, May 15, 2025, ran for about 10 days, and finished on Sunday, May 25, 2025. It averaged 87.63 dataset annotation runs per hour. Annotations took about 8.59 days to finish. This long runtime is primarily due to the complexity of the annotation pipeline, including annotation, crosswalking, and mean gene expression per cell type, to cover over 10,000 datasets and tens of millions of cells. Targeted optimization of the algorithms and workflows combined with more hardware resources and re-using annotations from prior runs will be required to reduce runtime. Work is underway to save annotations between runs to skip the re-annotation step. After a 22-day QA phase, the RUI2CTpop Workflow started on June 16 at 5:55:27 PM EDT and finished about four hours later at 10:07:11 PM EDT the same day. A full log is linked in Table S1. In the future, the run time for the DCTA Workflow will be decreased by using high performance computing (HPC), e.g., Big Red at Indiana University (kb.iu.edu/d/brcc). Also, the crosswalking will be moved to the RUI2CTpop Workflow, which will decrease runtime and increase the modularity of both workflows.
References
1. Bueckle, A., Herr II, B. W. & Börner, K. HRApop v1.0. Zenodo https://doi.org/10.5281/zenodo.15603820 (2025). https://doi.org/10.5281/zenodo.15603820.
2. Bueckle, A. et al. Construction, Deployment, and Usage of the Human Reference Atlas Knowledge Graph. Sci. Data 12, 1100 (2025). https://doi.org/10.1038/s41597-025-05183-6.
3. The Tabula Sapiens Consortium* et al. The Tabula Sapiens: A multiple-organ, single-cell transcriptomic atlas of humans. Science 376, eabl4896 (2022). https://doi.org/10.1126/science.abl4896.
4. Zilbauer, M. et al. A Roadmap for the Human Gut Cell Atlas. Nat. Rev. Gastroenterol. Hepatol. 20, 597–614 (2023). https://doi.org/10.1038/s41575-023-00784-1.
5. Li, M. et al. DISCO: a database of Deeply Integrated human Single-Cell Omics data. Nucleic Acids Res. 50, D596–D602 (2022). https://doi.org/10.1093/nar/gkab1020.
6. Hemberg, M. et al. Insights, opportunities, and challenges provided by large cell atlases. Genome Biol. 26, 358 (2025). https://doi.org/10.1186/s13059-025-03771-8.
7. Börner, K. et al. Human BioMolecular Atlas Program (HuBMAP): 3D Human Reference Atlas construction and usage. Nat. Methods 1–16 (2025). https://doi.org/10.1038/s41592-024-02563-5.
8. Weber, G. M., Ju, Y. & Börner, K. Considerations for Using the Vasculature as a Coordinate System to Map All the Cells in the Human Body. Front. Cardiovasc. Med. 7, (2020). https://doi.org/10.3389/fcvm.2020.00029.
9. Ghose, S. et al. 3D reconstruction of skin and spatial mapping of immune cell density, vascular distance and effects of sun exposure and aging. Commun. Biol. 6, 718 (2023). https://doi.org/10.1038/s42003-023-04991-z.
10. Jain, Y. et al. Exploring endothelial cell environments across organs in spatially resolved omics data. 2025.09.23.678129 Preprint at https://www.biorxiv.org/content/10.1101/2025.09.23.678129v1 (2025). https://doi.org/10.1101/2025.09.23.678129.
11. Black, S. et al. CODEX multiplexed tissue imaging with DNA-conjugated antibodies. Nat. Protoc. 16, 3802–3835 (2021). https://doi.org/10.1038/s41596-021-00556-8.
12. He, S. et al. High-plex imaging of RNA and proteins at subcellular resolution in fixed tissue by spatial molecular imaging. Nat. Biotechnol. 40, 1794–1806 (2022). https://doi.org/10.1038/s41587-022-01483-z.
13. Hu, J. et al. Benchmarking single cell transcriptome matching methods for incremental growth of reference atlases. 2025.04.10.648034 Preprint at https://www.biorxiv.org/content/10.1101/2025.04.10.648034v1 (2025). https://doi.org/10.1101/2025.04.10.648034.
14. Zhang, Y., Aevermann, B., Gala, R. & Scheuermann, R. H. Cell type matching in single-cell RNA-sequencing data using FR-Match. Sci. Rep. 12, 9996 (2022). https://doi.org/10.1038/s41598-022-14192-z.
15. Liu, A. et al. Discovery of optimal cell type classification marker genes from single cell RNA sequencing data. BMC Methods 1, 15 (2024). https://doi.org/10.1186/s44330-024-00015-2.