ㅤ
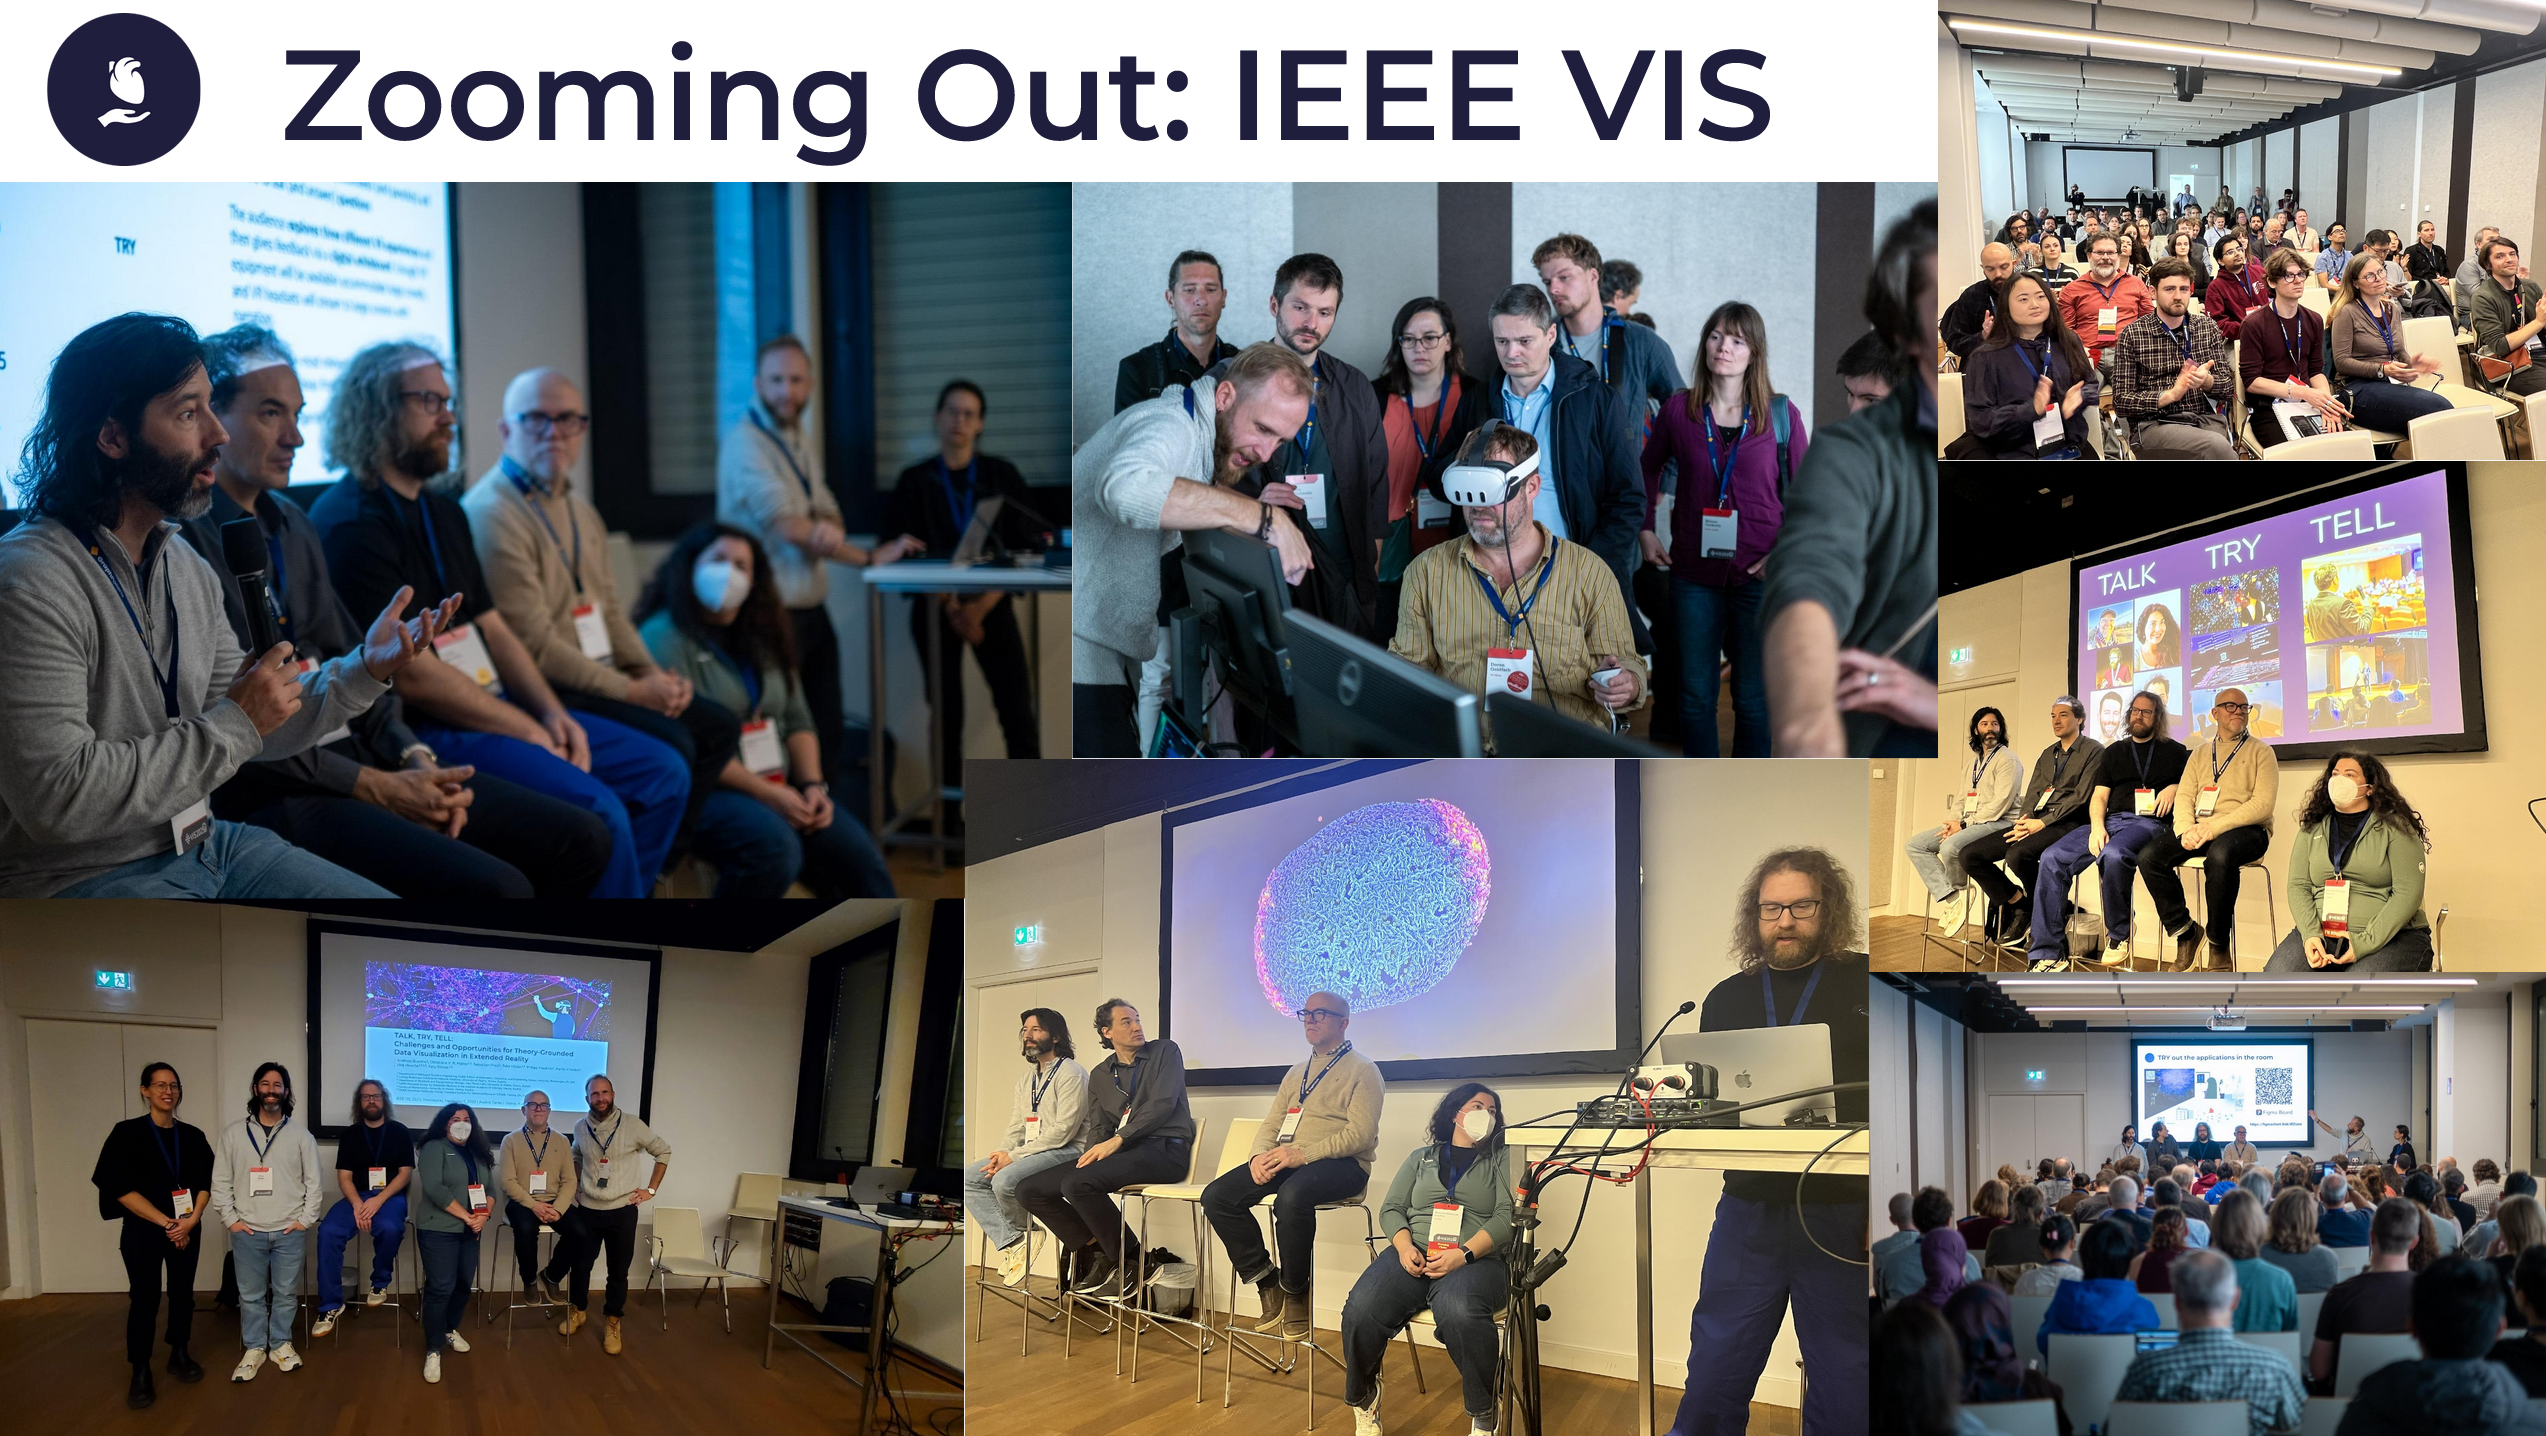
[IEEE VIS Panel] TALK, TRY, TELL: Challenges and Opportunities for Theory-Grounded Data Visualization in Extended Reality
Andreas Bueckle1, Christiane V. R. Hütter2,3, Sebastian Pirch2, Felix Müller2,3, Philipp Friedrich2, Martin Chiettini3, Jörg Menche2,3,4,5, Katy Börner1,6
1 Department of Intelligent Systems Engineering, Luddy School of Informatics, Computing, and Engineering, Indiana University, Bloomington, IN, USA
2 Ludwig Boltzmann Institute for Network Medicine, University of Vienna, Vienna, Austria
3 Department of Structural and Computational Biology, Max Perutz Labs, University of Vienna, Vienna, Austria
4 CeMM Research Center for Molecular Medicine of the Austrian Academy of Sciences, Vienna, Austria
5 Faculty of Mathematics, University of Vienna, Vienna, Austria
6 CIFAR MacMillan Multiscale Human, Canadian Institute for Advanced Research (CIFAR), Toronto, ON, Canada
Time and Date
Wednesday, November 5, 2025 11:15am - 12:30pm (CET) in room 0.11+0.12 during IEEE VIS
Motivation
2D visualization frameworks are screen bound and do not provide extensive human-data interaction modes, which XR can offer. 3D systems and environments open up the possibilities of intuitive interaction with three-dimensional data representations - to interpret and use those as effectively as established, mature 2D visualization tools, new supporting frameworks are needed.
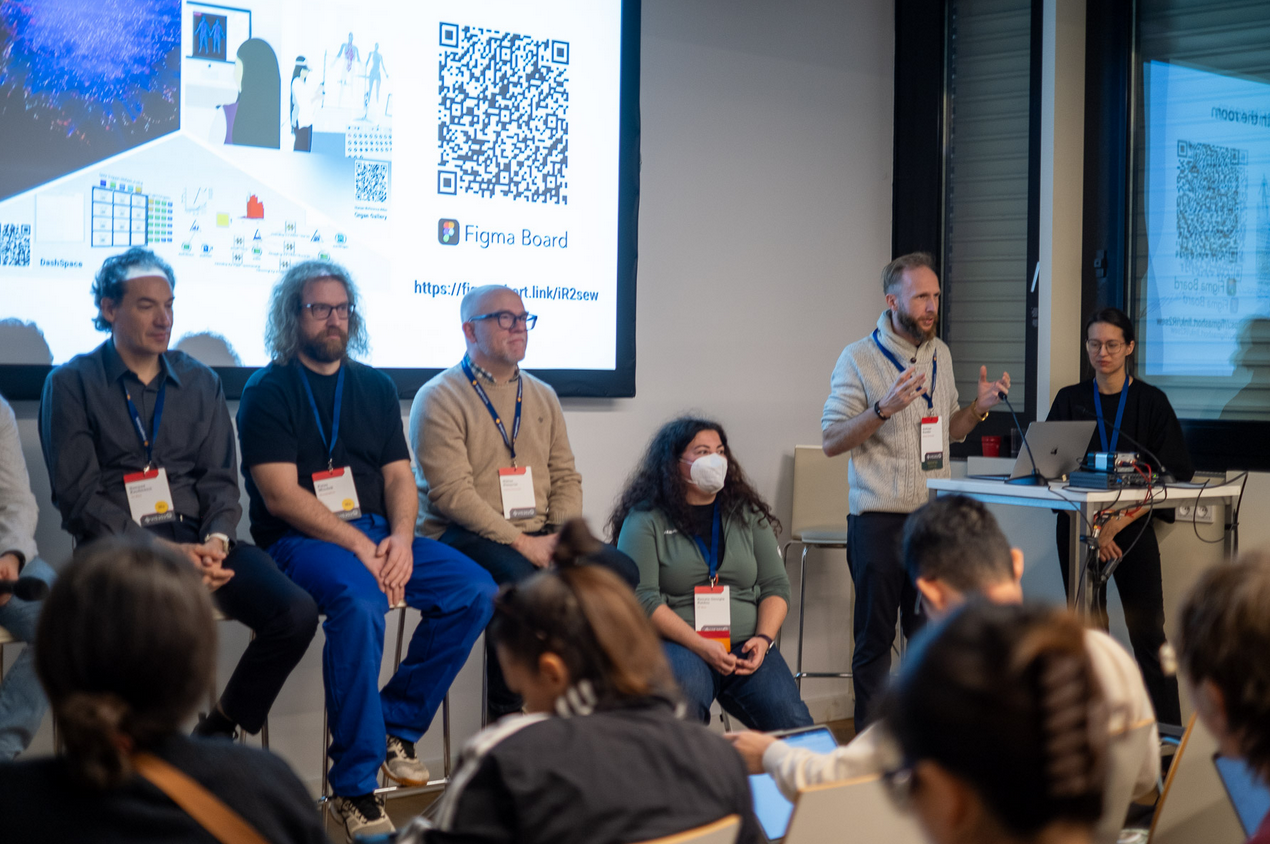
Images from the Event
Trailer
Abstract
Numerous formalizations have emerged for creating, interpreting, and teaching data visualizations. The past decade has witnessed significant advances in visualization paradigms beyond keyboard and mouse, like immersive analytics. Mature visualization ecosystems are established for screen-based technologies; however, no counterparts have emerged yet in the immersive visualization domain. Consistent implementations are limited due to scattered tools and platforms, while theoretical frameworks require extension to extended reality (XR).
“TALK, TRY, TELL: Challenges and Opportunities for Theory-Grounded Data Visualization in Extended Reality” addresses these gaps through an innovative “TALK, TRY, TELL” format that combines theoretical discourse with hands-on experience. Expert speakers present their own research on theory and practice and examine how established principles translate to immersive environments, representing a diverse and balanced spectrum from XR specialists and information designers, including implementers and theorists (TALK).
Following the presentations, attendees will engage with three virtual reality (VR) demonstration applications built on different engines and hardware to exemplify approaches in immersive analytics: biomedical data visualization involving 3D models of adult human anatomy, collaborative network visualization and analysis, as well as immersive and ubiquitous analysis via XR on the web (TRY).
During the TRY phase, the audience will be invited to share their insights on the individual experiences exhibited via a digital whiteboard (TELL). This format ensures attendees not only understand the conceptual challenges but also experience the perceptual and interaction complexities first-hand. The panel aims to establish a roadmap for developing both theoretical foundations and practical toolkits to advance data visualization in XR as a mature field with strong theory and practice within the visualization community.
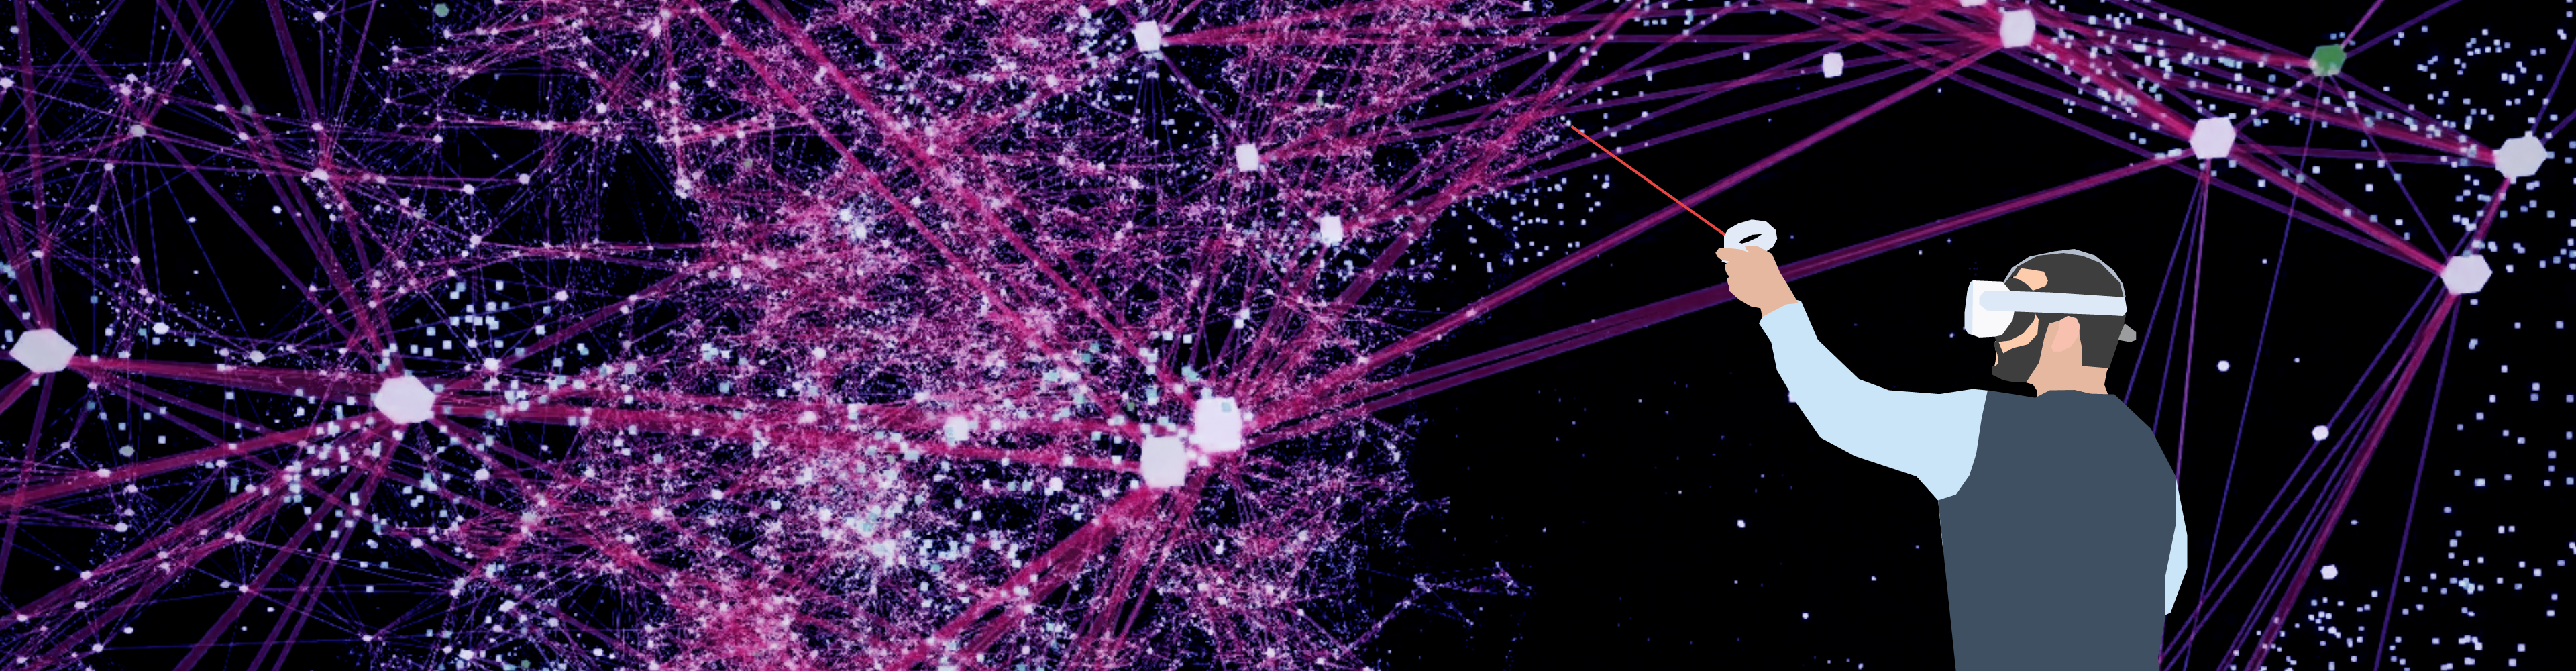
Figure 1. Talk, Try, Tell: We are proposing an innovative panel format to discuss theory-grounded data visualization in XR. Exemplarily shown is DataDiVR.
Description of the Panel Topic
Numerous formalizations have emerged for creating, interpreting, and teaching data visualizations. The past decade has seen significant advances in visualization paradigms beyond keyboard and mouse, such as immersive analytics, yet existing theoretical frameworks and practical tools remain inadequate for capturing the unique affordances of extended reality (XR) environments, such as virtual reality (VR), augmented reality (AR), and mixed reality (MR). While 2D (and, to some extent, 3D) visualizations benefit from mature ecosystems (seaborn, d3.js/Vega-Lite, ggplot2) and a cornucopia of no-code tools (Power BI, Tableau, Flourish), the XR landscape lacks equivalent standardized approaches. Current immersive visualization development is fragmented across platforms—Unity, Unreal Engine, WebXR—each requiring specialized expertise and offering limited theoretical grounding for design decisions and libraries to consistently implement them. This panel addresses these gaps through an innovative “TALK, TRY, TELL” format that combines theoretical discourse with hands-on experience. Five expert speakers will present their own research on XR visualization theory and practice and examine how established principles translate to immersive environments and where new frameworks are needed. Our panelists represent a diverse and balanced spectrum of expertise, including both XR specialists and information designers as well as implementers and theorists (TALK).
Following the presentations, the audience will engage with three VR applications that exemplify different approaches to immersive visual analytics: biomedical data visualization involving 3D models of human adult anatomy in the Human Reference Atlas (HRA) Organ Gallery in VR, implemented with Unity, running on the stand-alone, consumer-grade Meta Quest 3 (see Meta Horizon Store, collaborative network analysis in DataDiVR made with Unreal Engine and running on a VR-ready PC (TRY, see GitHub and Figure 1), and DashSpace, built natively for the web (see paper).
The hands-on experience will inform a final discussion synthesizing theoretical insights with practical observations from the demos. Concretely, during the TRY phase, the audience will be invited to share their insights on the individual experiences exhibited via a digital whiteboard (TELL). This format ensures attendees not only understand the conceptual challenges but also experience the perceptual and interaction complexities firsthand. The panel aims to establish a roadmap for developing both theoretical foundations and practical toolkits that can advance data visualization in XR as a mature field with strong theory and practice within the visualization community.
Short Description of the Panel Format and Anticipated Schedule
We will maximize the usefulness of this panel for all attendees, regardless of domain expertise and prior exposure to XR. To that end, panelists will give six-minute lightning talks, followed by a 20-minute moderated panel discussion and Q&A with audience involvement (TALK). Then, using the local presence of the organizers from the University of Vienna team, including Hütter and Menche, a 20-minute demo session will be held where attendees can try out some of the applications discussed in the panel (TRY). While this is active, there will be stations where we will solicit feedback and questions from the audience via a digital whiteboard. Finally, a 15-minute debriefing session will round up the 90-minute panel (TELL).
| Starts at [CET] | Duration [mins] | Activity | Description |
|---|---|---|---|
| 11:15 AM | 5 | Introduction | Organizers Bueckle and Hütter provide a brief intro to the goals of the panel |
| 11:20 AM | 30 | TALK | Lightning talks (5 mins per speaker and 1 min for transitions) with shared slide deck |
| 11:50 AM | 20 | Panel discussion | Following the lightning talks, attendees (and panelists) will be able to ask (and answer) questions |
| 12:10 PM | 20 | TRY | The audience explores three different VR experiences and then gives feedback via a digital whiteboard. Enough VR equipment will be available accommodate large crowds, and VR headsets will stream to large screens with narration. |
| 12:30 PM | 15 | TELL | Debriefing: The most relevant audience comments, questions, and ideas from the board will be discussed. |
| 12:45 PM | 1 | Group photo | Panelists and organizers take a photo on stage. |
TALK: Speakers/Panelists

Niklas Elmqvist, Ph.D., Villum Investigator and Professor, Department of Computer Science, Aarhus University, Aarhus, Denmark, and Director of the Center for Anytime Anywhere Analytics (CA3). Web: https://cs.au.dk/~elm/ Contribution/Expertise: Data visualization and human-computer interaction (HCI); coined the term “ubiquitous analytics”; working with immersive analytics; to offer insights and expertise into advanced and novel approaches of human-artificial intelligence (AI)/machine learning (ML) teamed interaction; to provide a foundation for integrating theory and practice—towards ubiquitous analytics from visual frameworks and design theory to immersive applications.

Dr. Renata G. Raidou, Associate Professor in Biomedical Visualization and Visual Analytics, Institute of Visual Computing and Human-Centered Technology, Vienna University of Technology, Austria. Web: http://www.renataraidou.com Contribution/Expertise: Visual analytics researcher with focus on data visualization within and beyond screens, including physical data representation approaches; application-driven research on data exploration and visual analytics; to extend discussion towards immersive digital and physical representation of complex data for diverse audiences.

Chris Bryan, Ph.D., Assistant Professor, School of Computing and Augmented Intelligence, Arizona State University, Tempe, AZ, USA. Web: https://chrisbryan.github.io Contribution/Expertise: Data visualization and visual analytics with a focus on human-centered design and explainability; emphasis on making complex data interpretable through interactive and accessible visual systems; to provide perspectives on explainable immersive visual analytics, bridging technical visualization systems with interpretability and usability for diverse audiences.

Dr. Hannes Kaufmann, Full Professor, Vienna University of Technology, Austria. Web: https://www.vr.tuwien.ac.at/people/hannes-kaufmann Contribution/Expertise: Virtual and augmented reality; design and realization of mixed reality lab including studios for immersive video recording, streaming and remote collaborations; to share user (developer) perspectives of software/hardware state-of-art.

Dr. Peter Mindek, Co-founder and Chief Technical Officer, Nanographics. Web: https://nanographics.at Contribution/Expertise: Scientific visualization, storytelling, visual abstraction, software architecture; to share a developer’s perspective on software requirements for creating high-quality visuals in real-time for interactive applications.
TRY: Applications
- HRA Organ Gallery VR: https://humanatlas.io/hra-organ-gallery
- DataDiVR: https://github.com/menchelab/DataDiVR_WebApp
- DashSpace: https://ieeexplore.ieee.org/document/10869395/
TELL: User Studies and Experiences
There will be a Figma board to collect input from users during the TRY phase.
Organizers

Andreas Bueckle, Ph.D. (https://andreas-bueckle.com), is the Research Lead in the Cyberinfrastructure for Network Science Center (CNS) at Indiana University. His research interest is information visualization in XR. He has a TEDx talk titled “Living and Learning in the Metaverse” (see this YouTube video). He was awarded a R03 award (see NIH Reporter) as well as two JumpStart Fellowships (https://hubmapconsortium.org/jumpstart-program/#andreas2024) by the National Institutes of Health to advance multiscale exploration of the human body in VR with the HRA Organ Gallery (https://humanatlas.io/hra-organ-gallery).

Christiane V. R. Hütter is an architect and computational bioengineer as well as Ph.D. Candidate at the Ludwig Boltzmann Institute for Network Medicine, working on visual data exploration in immersive systems. Her work extends beyond disciplines, curating (https://www.whatevr.xyz) and participating in various media art exhibitions (https://ars.electronica.art/center/en/events/deep-space-experience-premiere-connected-how-the-world-is-morethan-the-sum-of-its-parts).

Sebastian Pirch is a 3D digital artist, designer, lead developer, systems architect, and VR engineer at the Ludwig Boltzmann Institute for Network Medicine at the University of Vienna. His work is frequently exhibited at conferences, art venues, and international events, where he explores how digital tools, AI, and VR can enhance science communication and public engagement.

Felix Müller is a senior data scientist at the Ludwig Boltzmann Institute for Network Medicine, focusing on biological networks. He applies modern computational techniques to analyze biomedical data, integrating concepts from network theory, statistical physics, and machine learning to extract meaningful insights from large-scale biological interaction networks.

Philipp Friedrich is a software architect at the Ludwig Boltzmann Institute of Network Medicine at the University of Vienna, designing applications and systems tailored to the interactive analysis of large-scale complex and diverse data modalities.

Martin Chiettini is a digital artist, technologist, and IT infrastructure lead at the Ludwig Boltzmann Institute for Network Medicine at the University of Vienna and the Max Perutz Labs at the Vienna BioCenter. His artistic work explores the intersection of the physical and digital, often engaging with themes of spatial perception, performance art, and artificial intelligence.

Jörg Menche, Ph.D., is a professor at the University of Vienna, holding a dual appointment at the Max Perutz Labs and the Faculty of Mathematics, and is the director of the Ludwig Boltzmann Institute for Network Medicine. A physicist by training, his interdisciplinary team—spanning biology, bioinformatics, medicine, and the arts—leverages network theory to investigate molecular interactions underlying health and disease through cutting-edge technologies, from AI to VR.

Katy Börner, Ph.D., is the Victor H. Yngve Distinguished Professor of Engineering and Information Science in the Department of Intelligent Systems Engineering, Core Faculty of Cognitive Science, and Founding Director of CNS at Indiana University. She is a curator of the international Places and Spaces exhibit (https://scimaps.org). She was elected as an American Association for the Advancement of Science (AAAS) Fellow in 2012, obtained an Alexander von Humboldt Fellowship in 2017, and a Stiftung Charité Visiting Fellowship in 2025.
Description of VR Applications for Visualization Viewpoint
HRA Organ Gallery in VR
The HRA Organ Gallery in VR allows users to explore 77 organs with 2,600+ registered tissue blocks in the HRA v2.4 as well as single-cell data from eight organs, harmonized into the multi-scale HRA in immersive 3D and in their true size, location, and spatial relation to each other. It is under active development using Unity and runs on the Meta Quest 2, 3, 3S, and Pro headsets as a stand-alone application. It can be downloaded by anyone, free of charge, from the Meta Quest Store.
It features 3D meshes (organs, tissue blocks, light-sheet datasets, and confocal microscopy), dots (representing cells in 2D/3D space), and 2D/3D data visualizations (3D spike plots, bar graphs, scatter graphs) to visualize biomarker expression values for senescent cells and light-sheet microscopy. The 3D spike plot shown in Fig. 1 was created using standard UI components in Unity, i.e., dot sprites for the about 5,000 dots on the ground and line meshes for the 3D spikes. No visualization library was used. A detailed walkthrough of the data and visualization shown is provided on YouTube.
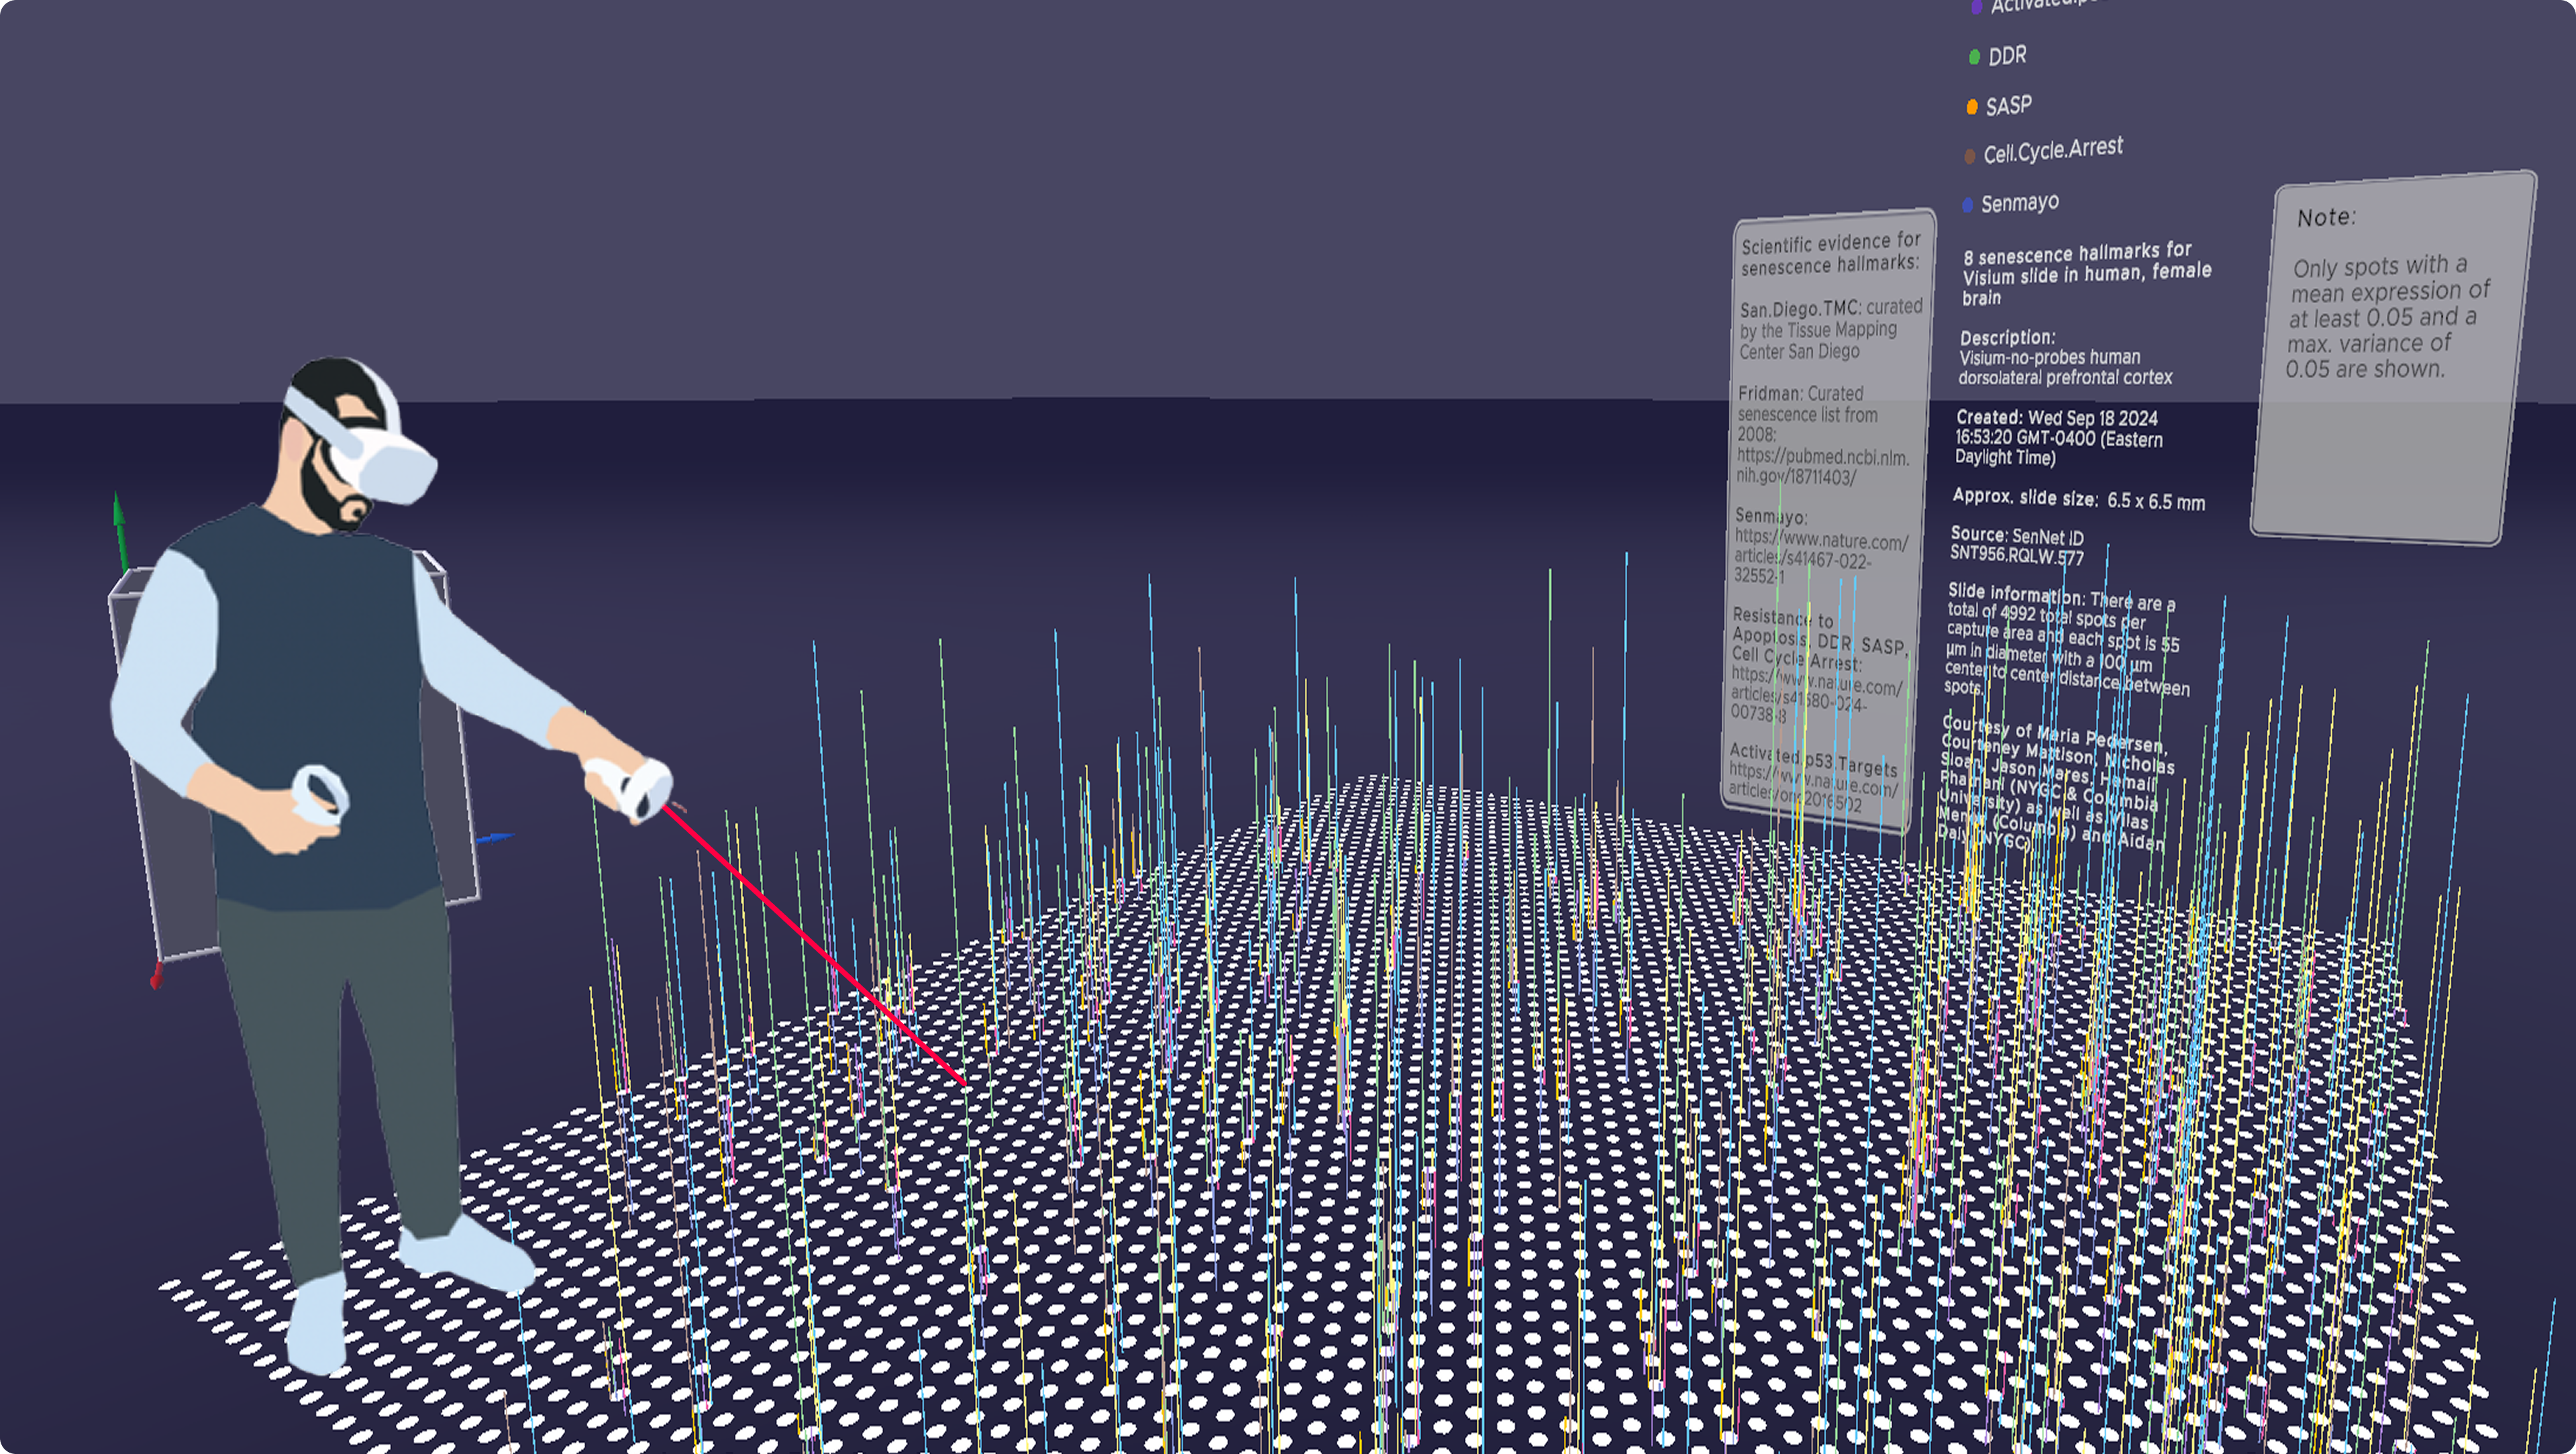
Supplemental Figure 1: Among other visualization types, the HRA Organ Gallery enables the creation of 3D spike plots for biomarkers expressions over a Visium slide, where each dot contains average expressions for eight senescence biomarkers (also called hallmarks) for all the cells captured in that circular area.
Data DiVR
Data DiVR is a VR data visualization platform developed with Unreal Engine that allows users to explore complex datasets within a Windows-based desktop environment using different network layout algorithms.
It features points, voxels, and node-link diagrams representing systems such as protein-protein interaction networks with large node and edge counts, enabling the analysis of both spatial and relational information. The tool offers flexible interface modalities, featuring an immersive VR experience with a dedicated graphical UI (GUI) inside the virtual environment, as well as a desktop mode where a 2D GUI and a 2.5D visualization preview are displayed.
Designed for collaboration, both modalities, i.e., VR and desktop, can be used in a joint data exploration process, supporting a multi-player setup that facilitates mixed user scenarios, allowing seamless interaction between users in VR and those on traditional screens (VR-to-VR, VR-to-desktop, or desktop-to-desktop).
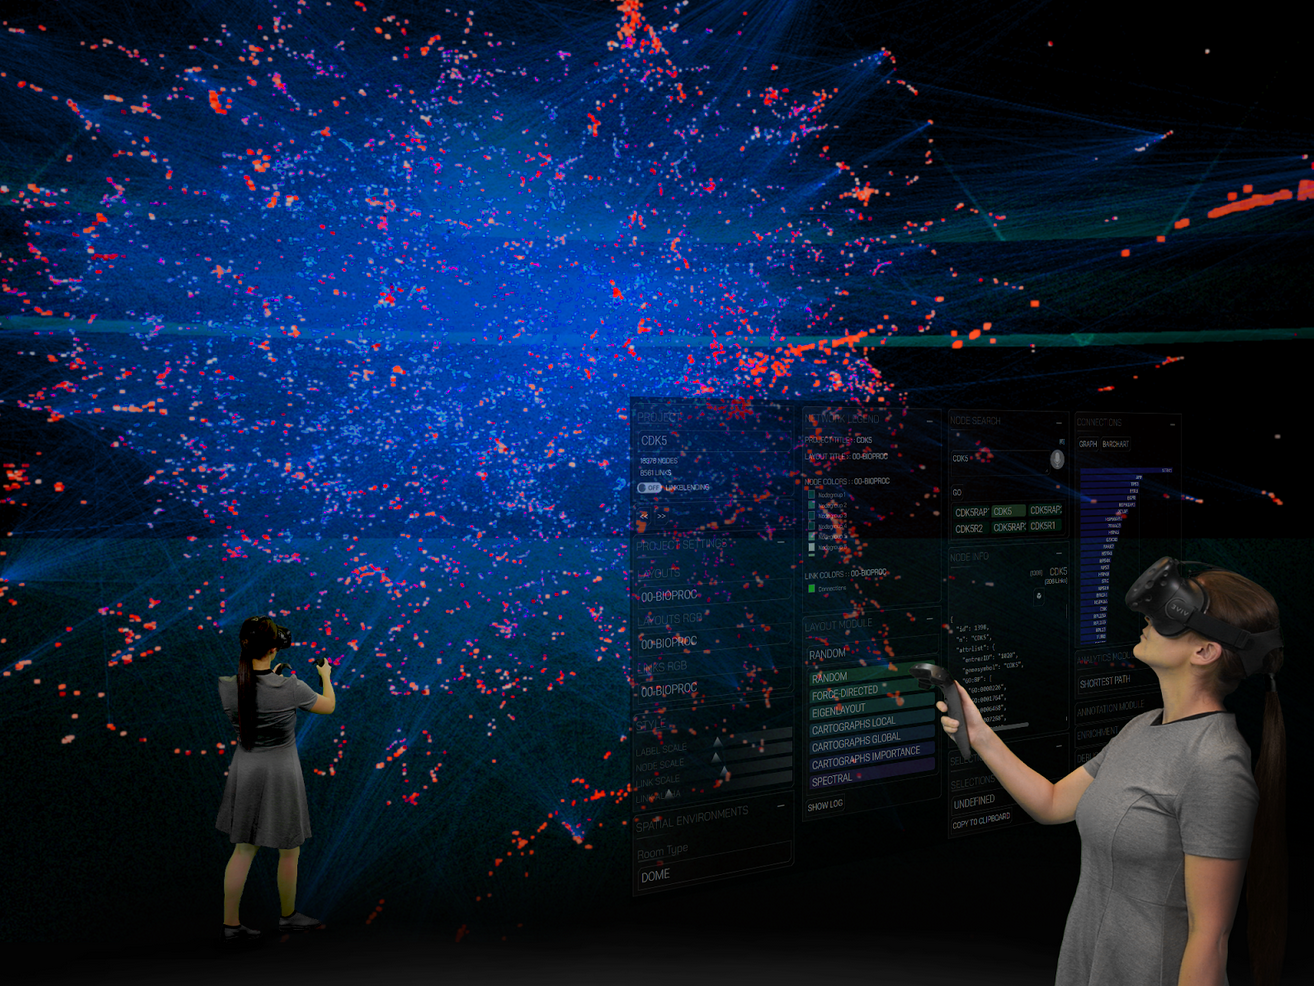
Supplemental Figure 2: Data DiVR enables the exploration of networks with different network layout algorithms in a 3D, embodied setting.
DashSpace
DashSpace is a live, collaborative platform for immersive and ubiquitous analytics that allows users to explore and author visualizations in shared 3D environments using open web standards like WebXR.
Developed on the Webstrates software stack, it runs directly in browsers on various devices, including smartphones, tablets, and XR devices like the Meta Quest 3 and Apple Vision Pro, without requiring native app installation.
It supports a range of visualization types, from legacy 2D charts (D3 and Vega-Lite) to 3D representations using the Optomancy grammar, which can be dynamically constructed or modified by dragging and dropping specification “snippets” in XR.
DashSpace facilitates both co-located and remote collaboration through real-time state persistence, 3D avatars with integrated WebRTC video feeds, and cross-platform screen sharing.
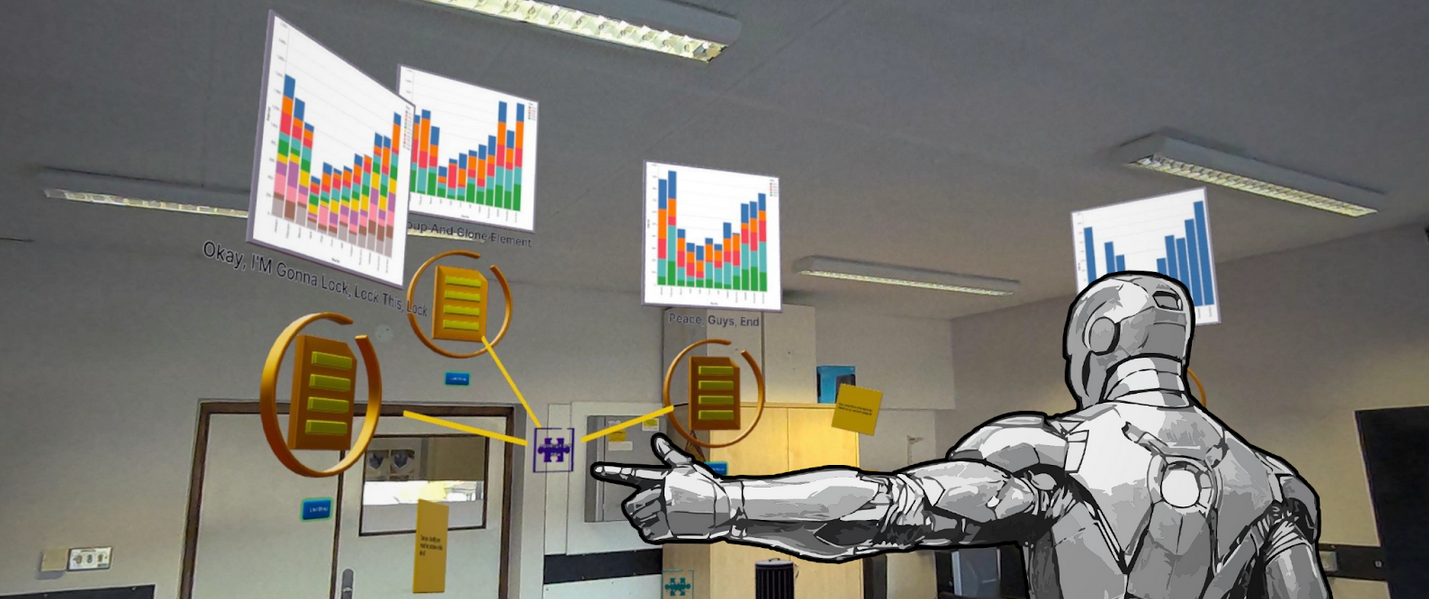
Supplemental Figure 3: Participant analyzing data in AR using DashSpace (anonymized through creative license). At this point in the study, the participant spontaneously said “I feel like Iron Man!” after modifying three visualizations by adding a single piece that connects to all three and sorts their X-axis.
Supplemental Table 1 for Visualization Viewpoint
Overview of the three major platforms for XR development and their key features.
| Property | Unity | Unreal Engine | WebXR |
|---|---|---|---|
| Platform | Game engine; commercial | Game engine; commercial | Web API for using XR devices in a web browser; predominantly open-source |
| Primary Strength | Cross-platform, rapid prototyping, mobile/stand-alone VR, big community and learning resources | High-fidelity graphics, photorealism, complex physics, cinematic quality, no programming experience needed (Blueprints) | Accessibility, instant access via web browser, platform-agnostic, low barrier to entry, no installation needed for end user |
| Scientific Use Case | Interactive training, medical simulations, mobile AR/VR field studies, UI-heavy apps | High-resolution scientific visualization, complex real-time physical simulations, architectural/engineering visualization | Dissemination of results, online education, lightweight data visualization, immersive analytics on the web |
| Visual Fidelity | Very good, but often requires more configuration to match Unreal Engine’s out-of-the-box quality | Industry-leading for photorealistic and high-end rendering | Dependent on the underlying library and browser capabilities; typically lower than native game engines |
| Performance | Generally well-optimized for a broad range of hardware, better for mobile/lower-end devices | Requires significantly higher-end hardware (GPU/RAM) to leverage full graphical features, default settings need much compute | Lower performance ceiling than native game engines due to browser overhead, but often sufficient for many data visualization tasks |
| Deployment/Access | Builds for almost all environments (desktop, mobile, stand-alone VR, WebXR), also gaming consoles | Excels on PC VR and high-end consoles; limited official WebXR support | Highest accessibility; no installation required; runs on any WebXR-compatible browser/device |
Supplemental Table 2 for Visualization Viewpoint
Existing XR visualization libraries plus their key properties and links to resources. This table is not exhaustive.
| Name | Platform | Description | Resources |
|---|---|---|---|
| Immersive Analytics Toolkit (IATK) | Unity | A Unity project to help build high quality, interactive and scalable data visualisations in Immersive Environments | Paper, Code |
| ImAxes | Unity | An immersive system for exploring multivariate data using fluid, modeless interaction, based on embodied data axes to be manipulated like physical objects in space. | Paper, Code |
| anu.js | WebXR | An immersive data visualization toolkit built on the web-based 3D game engine Babylon.js and WebXR, uses by D3 | Code |
| XROps | Unity/web | A web-based authoring system using interactive visual programming without coding expertise to create and modify immersive analytics applications dynamically | Paper |
| u2vis | Unity | A basic framework with 2D and 3D charts (like scatter plots, line charts, pie charts and parallel coordinates) to build extendable and customizable visualizations with AR/VR support. | Code |
| DashSpace | WebXR | High-level visualization toolkit for AR/XR with direct manipulation authoring | Paper |
| SpatialStrates | WebXR | Web-based middleware for AR/XR/VR rendering; supports DashSpace | Paper, Code |
| DataDiVR web app | Unreal | A flask server for server-client connection from python-based backend to unreal engine-based frontend | Paper, Code |
| Data Charts (Plugin) | Unreal | A collection of Blueprint-ready actors for Pie, Bar, and Line charts | Documentation |
| VR Expansion (Plugin) | Unreal | To help facilitate advanced Virtual Reality interactions and gameplay elements, such as handling large amounts of meshes | Documentation |
| Cognitive3D | Unreal | Focuses on the spatial representation of complex behavioral data | Code, Documentation |
Acknowledgments
This panel was made possible through support from the the CIFAR MacMillan Multiscale Human program.
About
This companion website for the panel is maintained by the organizers. Andreas Bueckle, Christiane V.R. Hütter, Martin Chettini, and Philipp Friedrich contributed text and images.